Editing visualizations is supported directly within Compose.
Prior to Edit mode in Compose, editing visualizations on slides required leaving Compose and going back to the Results panel in Analyze to make the necessary changes.
The need to switch back and forth between Analyze and Compose when formatting slide content was eliminated with the addition of Edit mode.
Editing a visualization through the Edit mode in Compose is a more seamless, integrated process.
As changes are made, the updates to the visualization can now be viewed immediately.
To enable Edit mode on a visualization, start with the following steps:
1. Add content to a slide in Compose
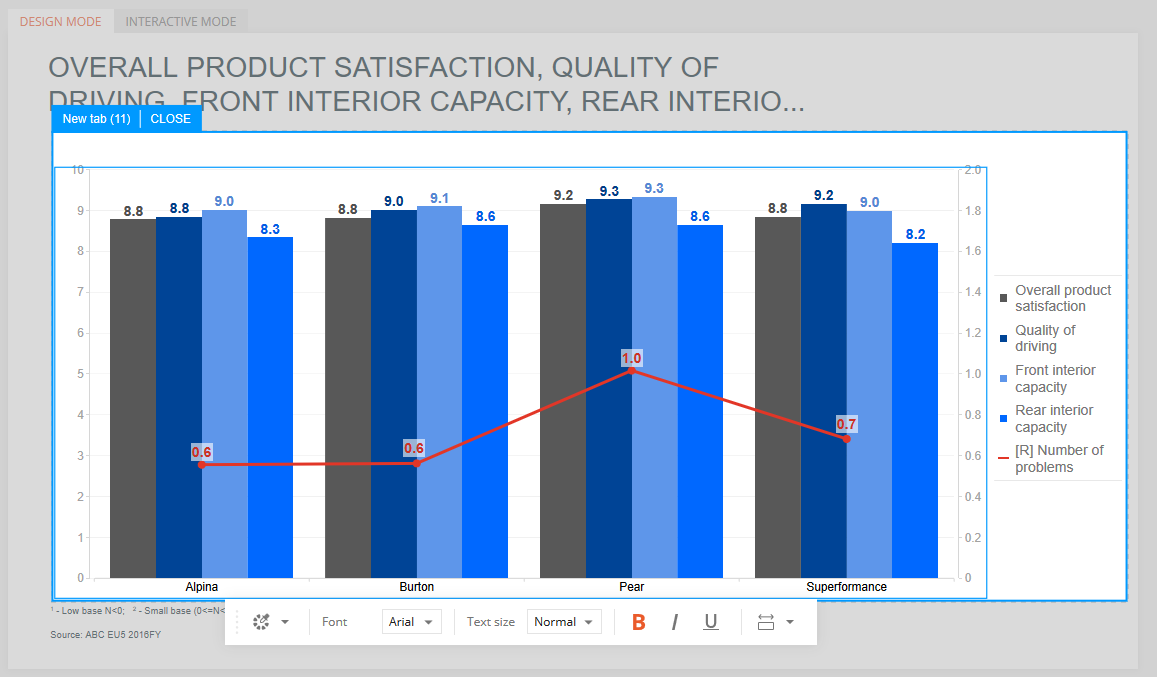
2. Remain in Design Mode
(Interactive Mode does not support editing.)
3. Click on the visualization within the slide to enable Edit mode.
(A blue Edit tab will appear in the top-left corner of the visualization.)
4. After clicking Edit, a toolbox will appear beneath the visualization.
This toolbox is available when editing the following chart types:
Structure Analysis
Frequency Analysis
Scatterplot
Bar/Line Chart
Pie Chart
The available options in the toolbox will vary depending on the chart type.
However, a standard set of editing options are available when editing any of the charts:
Selecting a different color palette
Changing the font size
Changing the font style (bold, underline, italics)