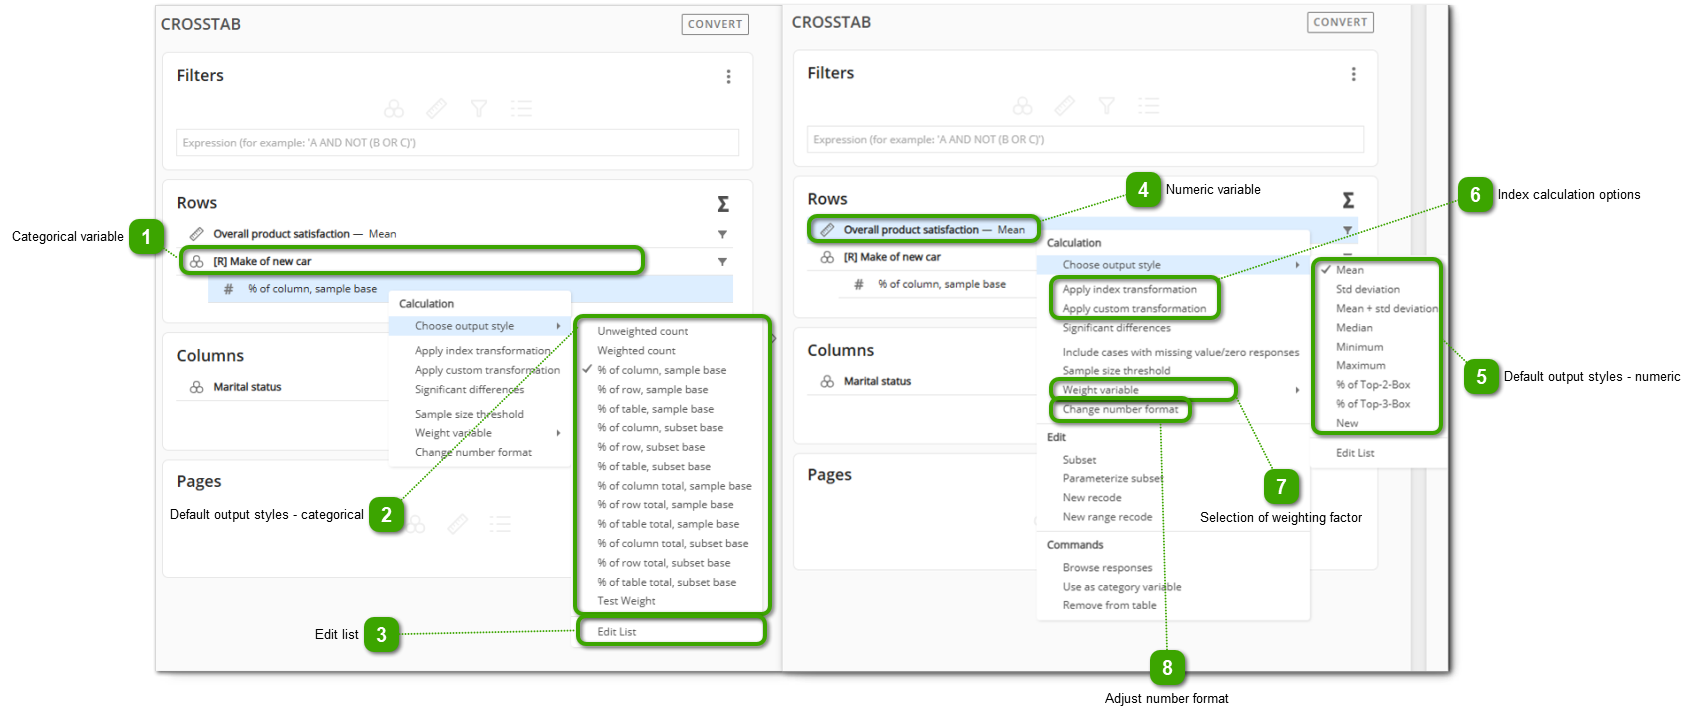
what kinds of calculations will be applied in the query
how the results will be displayed in the spreadsheet
In general, the output style is a list of chosen statistics in a given order.
What kinds of output styles are available?
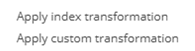
Several output styles have already been defined; however, keep in mind that you can also define your own output style using any of the many statistics, counts, and percentages available to you in Halo Reports (read more in User Output Styles) .
Default output styles differ for numeric and categorical variables. See the list below.
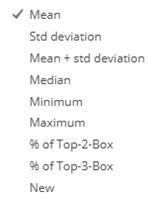
Numeric variable
Categorical variables
mean
standard deviation
mean + standard deviation
median
minimum
maximum
% of Top-2-Box
% of Top-3-Box
unweighted count
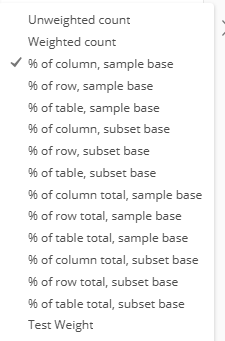
weighted count
% of column, sample base
% of row, sample base
% of table, sample base
% of column, subset base
% of row, subset base
% of table, subset base
% of Top-2-Box (if available)
% of Top-3-Box (if available)
% of column total, sample base
% of row total, sample base
% of table total, sample base
% of column total, subset base
% of row total, subset base
% of table total, subset base
Sample base or subset base?
Note that applying the subset base output only makes sense if you have defined a subset. The percentages will then be calculated out of the total subset. If you choose the sample base output, then even if there is a subset defined on a variable, the percentages will be calculated out of the whole sample in rows or columns accordingly.
Compare the two alternative views of the Columns area, with numeric variable output styles on the left and categorical variable output styles on the right.
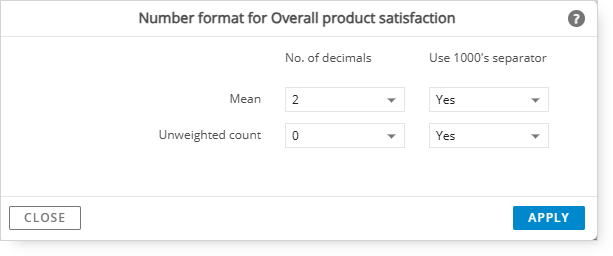
Adjust the number format for individual calculation. After clicking on this option you will see the following window. These settings will be applied only for the selected question in the selected project.