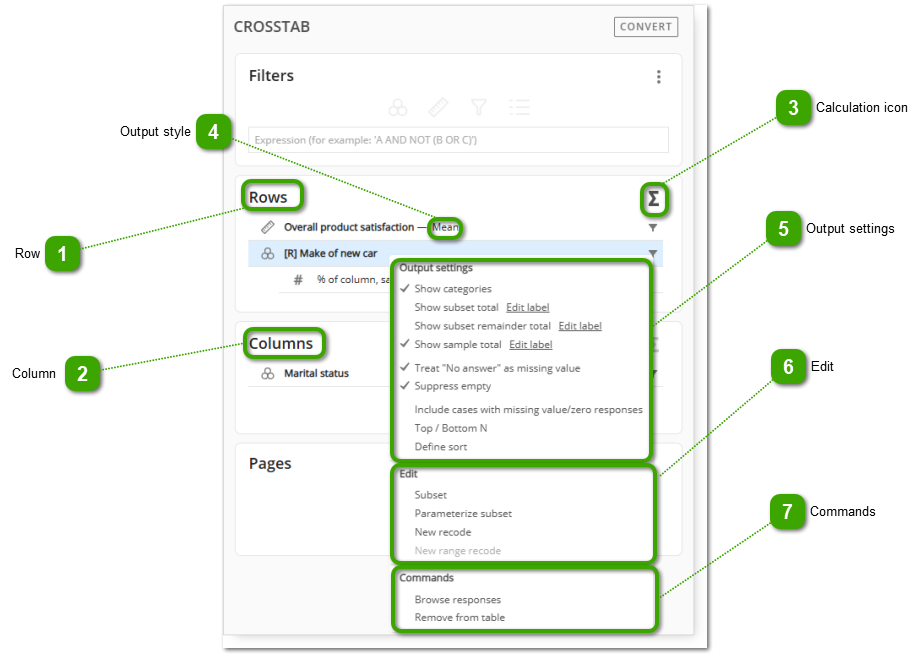
Once the datasets are selected, you can proceed to the proper project. The objective is to create a spreadsheet or visualization that will provide the desired information extracted from the selected dataset. The process of delivering information starts with placing variables of your interest in the four areas below.
First of all, rows and columns form a basic table. In both areas, you can place more than one variable, either on the same level, which will create multiple tables in the same spreadsheet, or nested, in order to include all the variables in one table (see: Nesting). It is possible to transpose the variables from columns to rows or inversely, however, it is important to note in which dimension the calculations are currently being performed. Although the categorical variables fit in both fields, the numeric variables can only be placed in the calculation area (marked with the sigma-shaped icon described below). Also see: Calculations: in Rows or in Columns?
Pages add a third dimension to your table. For more details, see: Using Pages
Filter is a very useful tool that allows you to reduce the sample in respect to a certain quality. It is possible to impose several filters on the sample (see: Using Filters). At the same time, it is crucial to distinguish between the general filter which creates a subset applied to the whole sample, and creating subsets of variables located in rows, columns or pages, which create subsets locally.
Row
Click on a variable in the Question section and locate it in the Rows area. The variable will automatically land in the right place. Alternatively, right-click on the variable and select "Add to Rows."
Move the variable to the Column area. This variable will be displayed in columns. Alternatively, right-click on the variable and select "Add to Columns".
The letter sigma indicates that the calculations are now being made for columns. For information on how to perform calculations on rows, see: Calculations: in Rows or in Columns?.
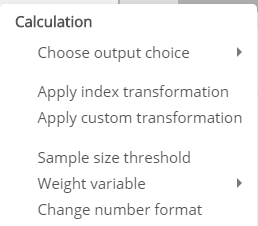
Different output styles allow you to choose how you want the values to be displayed (see: Selecting an Output Style). Within this menu, it is also possible to change the weighting factor (see: Selection of Weighting Factor).