A scatterplot is a visualization that includes bubbles instead of bars.
The Scatterplot query does not include panels for rows and column output during setup.
Instead, the setup includes panels for Categories and KPIs.
Questions included in categories appear as separate bubbles per response within the categorical question.
(e.g., the Brand of Purchased Item will show separate bubbles for Brand A, Brand B, Brand C, Brand D, etc.)
KPIs will show attributes for each bubble.
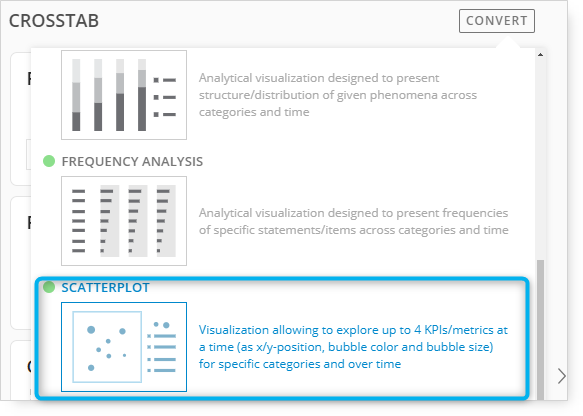
Up to 4 KPIs/metrics can be displayed in a Scatterplot visualization. (X & Y position, bubble color, and bubble size)
The following example includes options and settings for a Scatterplot visualization.
Begin by changing the tab template to Scatterplot.
Multiple questions can be included in the Categories and KPIs panels.
Optional questions can be included in the Filters panel.
Categories
Market Category of New Car and Segment of New Car are included in the Categories panel.
KPIs
Include multiple KPIs in the KPIs panel to expand the options for analysis in the data universe.
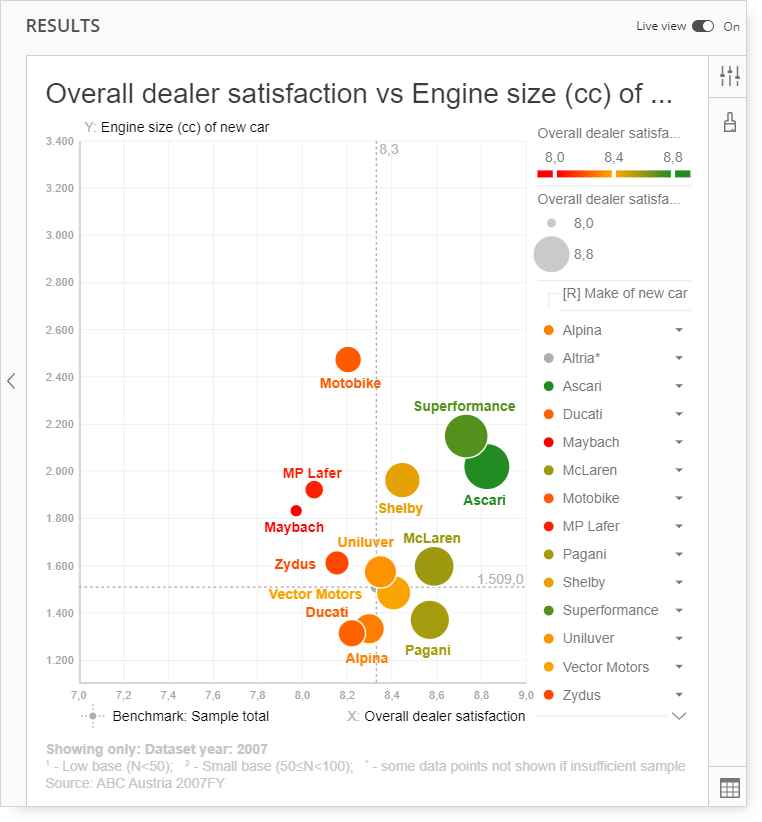
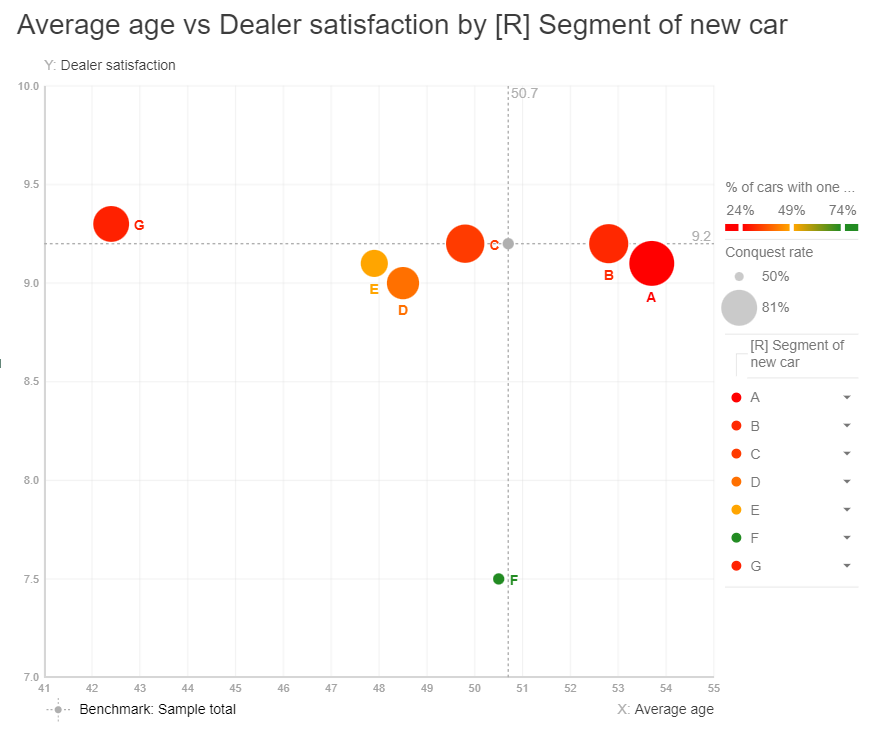
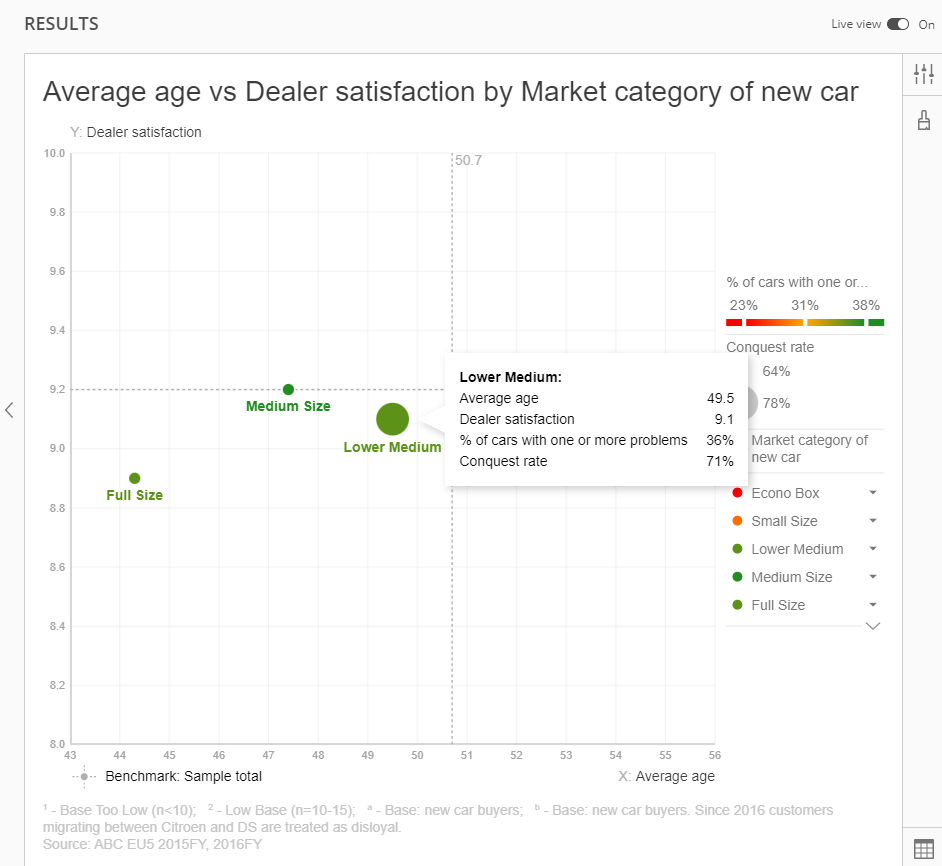
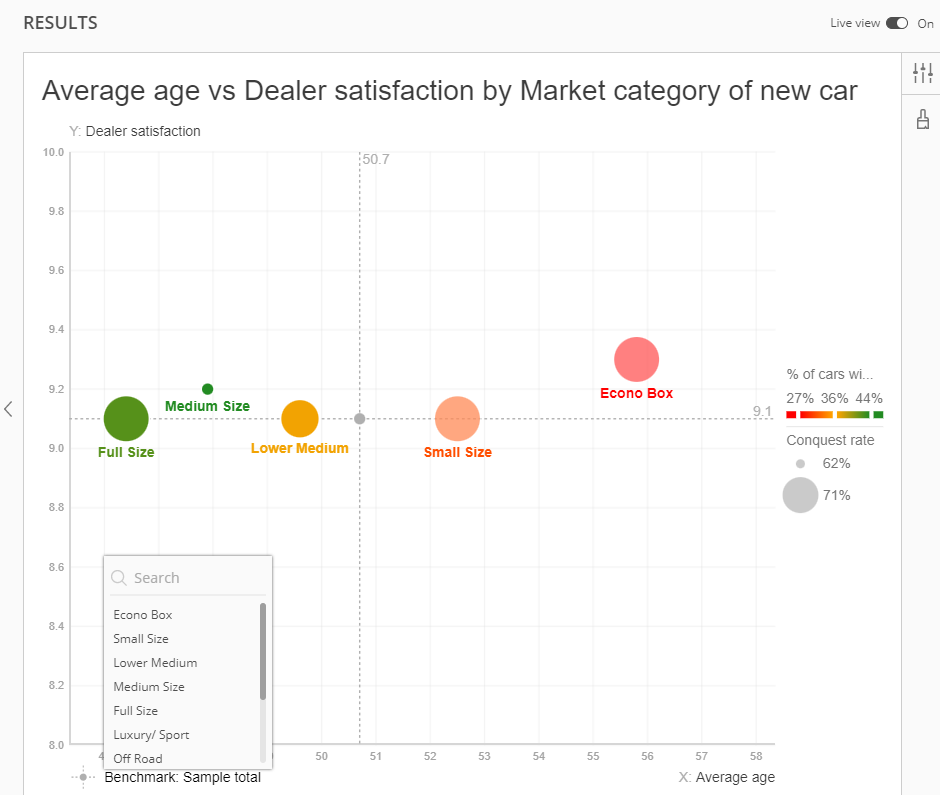
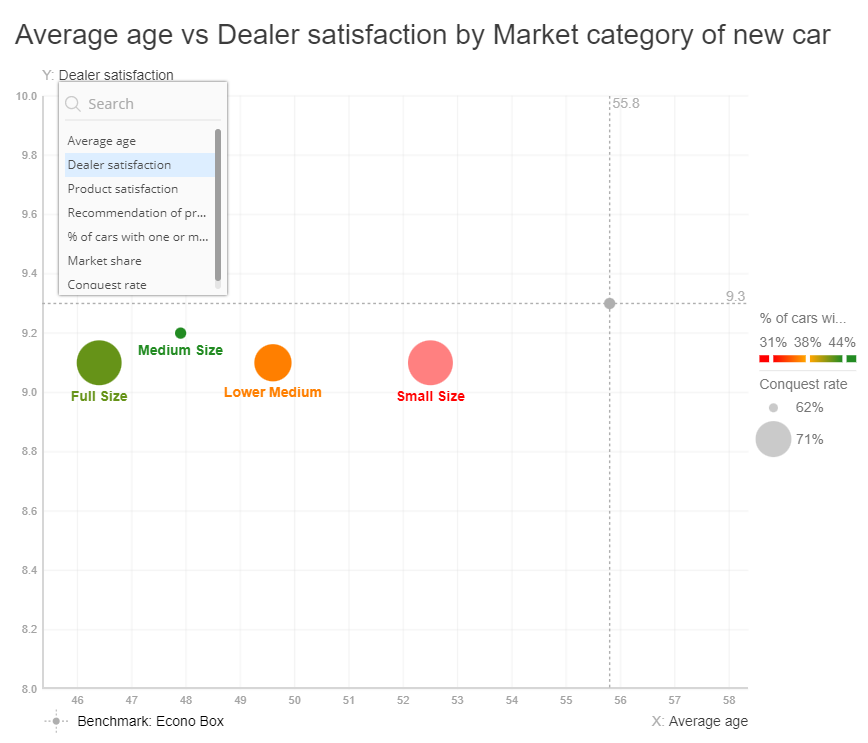
In the visualization above, each Market Category response is displayed as a separate bubble. The KPIs are used for each bubble's position, size, and color.
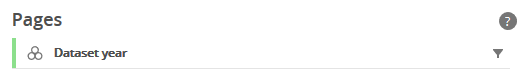
Pages
Adding the Dataset Year to the Pages panel allows for specifying and displaying only a single year of data.
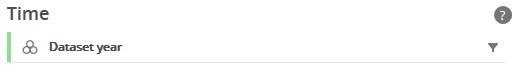
Time
As another option, Dataset Year can instead be included in the Time panel. This will allow to trend and benchmark of data across years.
By default, the most recent year will be displayed initially.
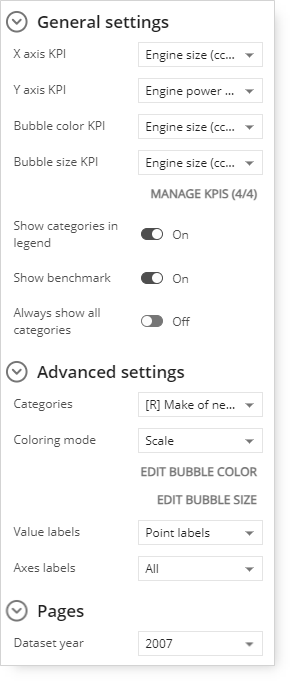
Click the General Settings icon to display the available options.
KPI Settings
KPIs display attributes for each bubble.
Up to 4 KPIs can be displayed per bubble (category response).
KPIs are required for the X-axis and Y-axis since these are the plot points for each bubble.
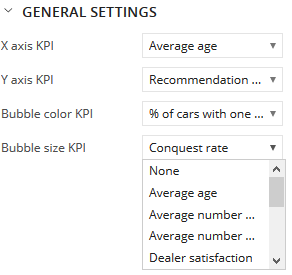
Bubble color and Bubble Size are optional. If displaying bubble color and size is not required, select the None option.
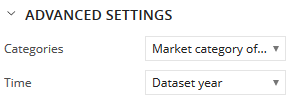
Category Settings
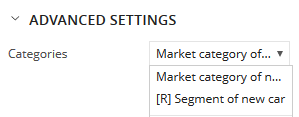
Expand the Advanced Settings options and click the Categories drop-down menu.
In the example above, Market Category and Segment were included in the Categories panel during setup, which makes them available as options in the Categories menu.
Selecting the Segment of New Car menu option changes the analysis from the Market Category of New Cars (Econobox, Small Size, Lower Medium, etc.) to the Segment (Segment A, B, C, etc.).
Pages and Time
During the query setup, multiple years of data were included.
When working with multiple years of data, the Dataset year can be included in either the Pages or Time panel.
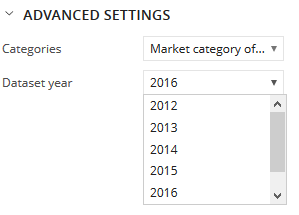
If the Dataset year is included in the Pages panel, a selector menu will appear in the Advanced Settings to allow the display of one year of data in the Scatterplot.
Including Dataset year in Pages will treat each year like a filter. An individual year of data will be shown at one time.
If the Dataset year is included in the Time panel, it will appear under the Advanced Settings as a Time selector.
However, when included in the Time panel, no additional selection is required. By default, the most recent year's data will be shown in the Scatterplot.
In the three examples below, 2016 is the most recent year.
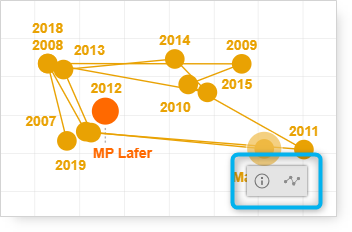
Clicking on any of the bubbles will display additional features.
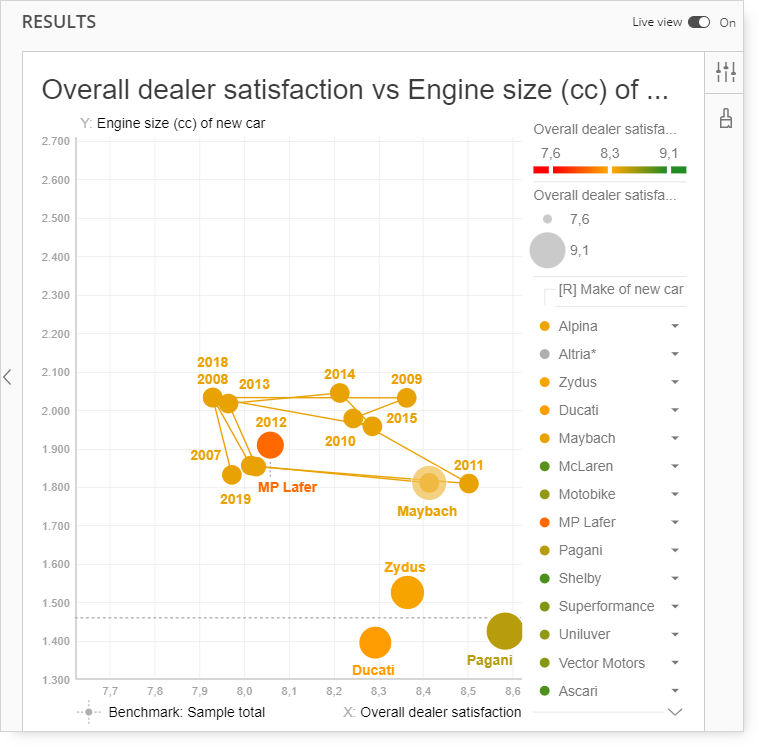
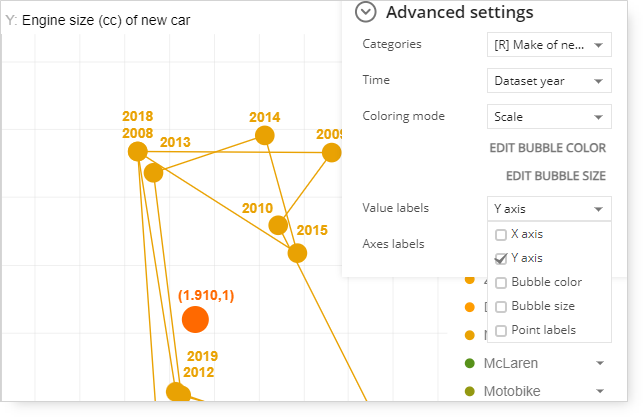
The optional Time Series setting can be turned on to introduce multiple years of analysis.
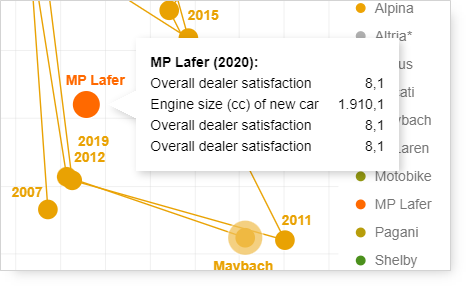
Click the information icon ( i ) to display the data points for the most recent year of data.
Benchmark
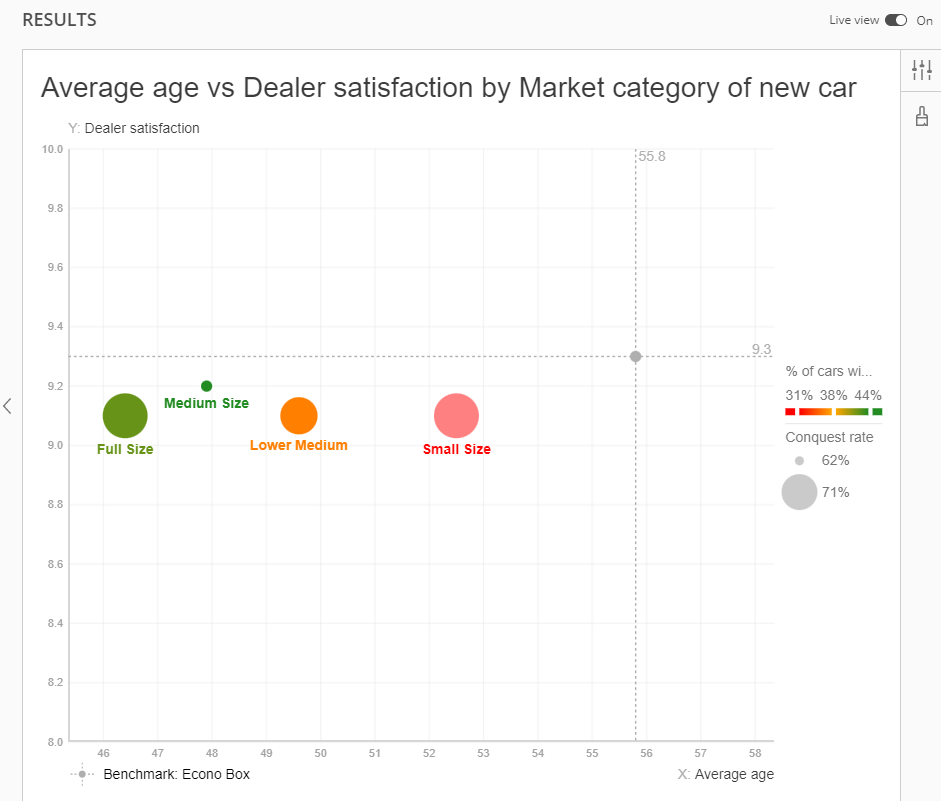
The value of another category can be selected as a benchmark. The default benchmark is the Sample total.
Once the benchmark is changed to the Econo box, the values of this benchmark are displayed on the chart.
Selecting KPI
KPI can be changed directly on the chart. This selection can be amended for the Y and X axes simultaneously.
Value Labels
To show the values of the KPIs, expand the Value Labels menu.
Optional checkboxes are available for the four KPIs used for: