User Guide
×
Menu
Index
 

Frequency Analysis Settings - Overview

 
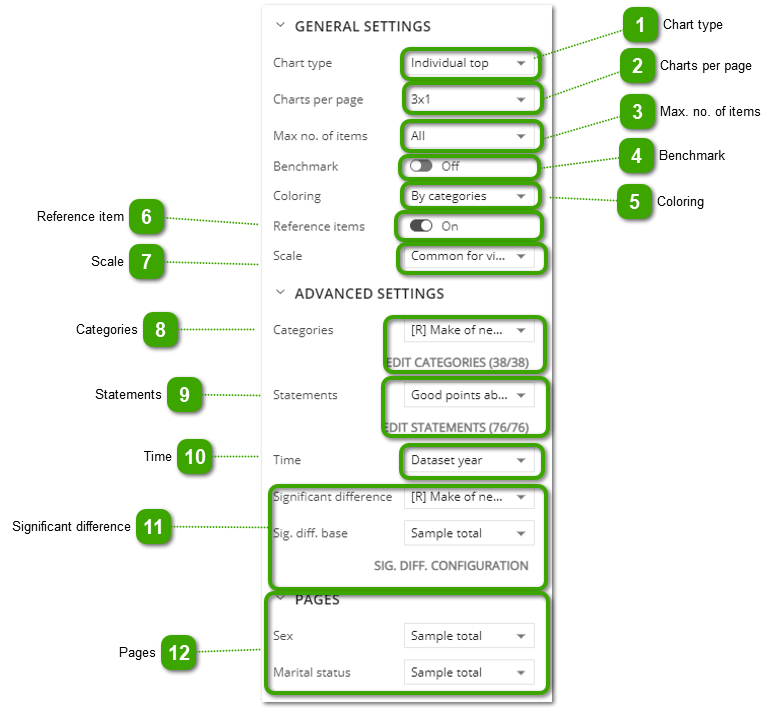
To further adjust the Frequency Analysis chart, use the General and Advanced settings options available at the top right-hand corner  
 
Frequency Analysis Settings - Overview
1

Chart type

 1. Chart type
  • You can choose either 'Individual Top' or 'Reference Top'.
  • 'Individual Top' allows you to display the statements sorted separately within each category.
    'Reference Top' allows for an easy comparison of statement values between categories by forcing a fixed order of statements with the first category displayed on the chart treated as a reference.
2

Charts per page

2. Charts per page
Here, you can select several charts per page.
3

Max. no. of items

3. Max. no. of items
Here, you can select the maximum number of items presented on the chart.
4

Benchmark

4. Benchmark
You can display benchmark values only if you add a time dimension added to the Time section and if you switch the Benchmark option to 'On'.
5

Coloring

5. Coloring
Here, you can choose the specific colors of the chart items and color them 'By categories', 'By statements', or 'Reference item only.'
6

Reference item

6. Reference item
This switch activates the reference item line that is visible on all of the separate charts. Under the chart there is a legend where you can change the reference item to a different one.
7

Scale

7. Scale
Here, you can adjust the scale and select one of two options: 'Common for all data' or 'Common for visible data.'
8

Categories

8. Categories
Here, you can amend the categories.
9

Statements

9. Statements
 
Here, you can change the statements.
10

Time

10. Time
You can adjust here the time dimension.
11

Significant difference

 
11. Significant difference
You can switch on the Significant Difference option and adjust it to your needs by going into the Significant Difference configuration.
12

Pages

12. Pages
Here, you can adjust the variables you added to the Pages panel.