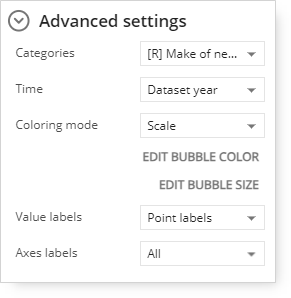
Color Mode on Scatterplot
The following bubble coloring options are available:
By default, the coloring mode for the bubbles is set to Scale.
Bubble colors will fall within the range of colors.
The colors and range values are customizable under Advanced Settings in the Edit Bubble Color option.
The Good/Bad coloring mode option uses two preset colors (red and green).
In the example above, any bubble value less than 39% is red, and any value 39% or higher is green.
(No bubble's value is 39% or higher; therefore, there are no green bubbles in the example.)
The range for good and bad values is customizable in the Edit Bubble Color option under Advanced Settings.
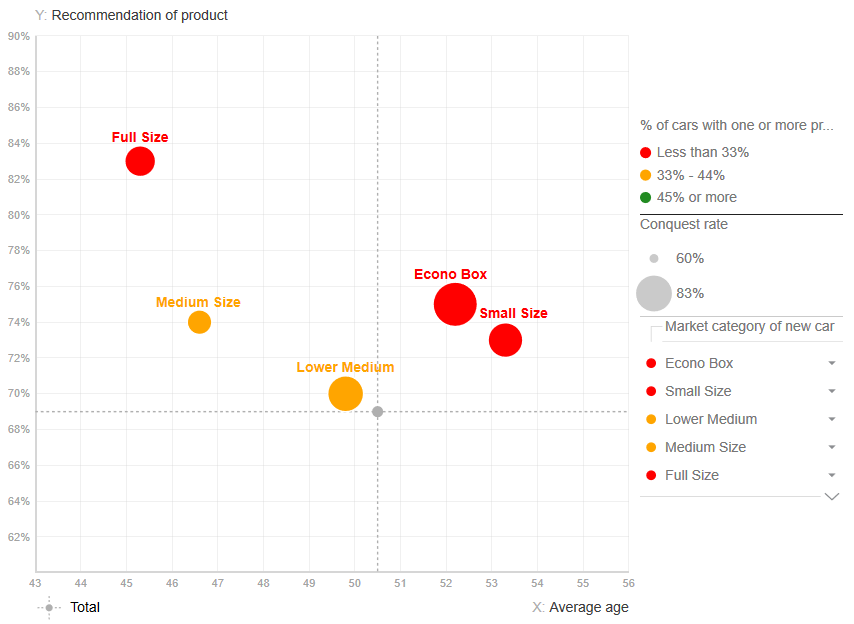
The Traffic Lights coloring mode option is similar to the Good/Bad option, except that Traffic Lights uses three preset colors (red, yellow, and green).
In the example above, any bubble value less than 39% is red, between 33% and 44% is yellow, and any value 45% or higher is green.
(No bubble's value is 45% or higher; therefore, there are no green bubbles in the example.)
The ranges for red, yellow, and green values are customizable in the Edit Bubble Color option under Advanced Settings.
Bubble colors will fall within the range of colors.
The colors and range values are customizable under Advanced Settings in the Edit Bubble Color option.
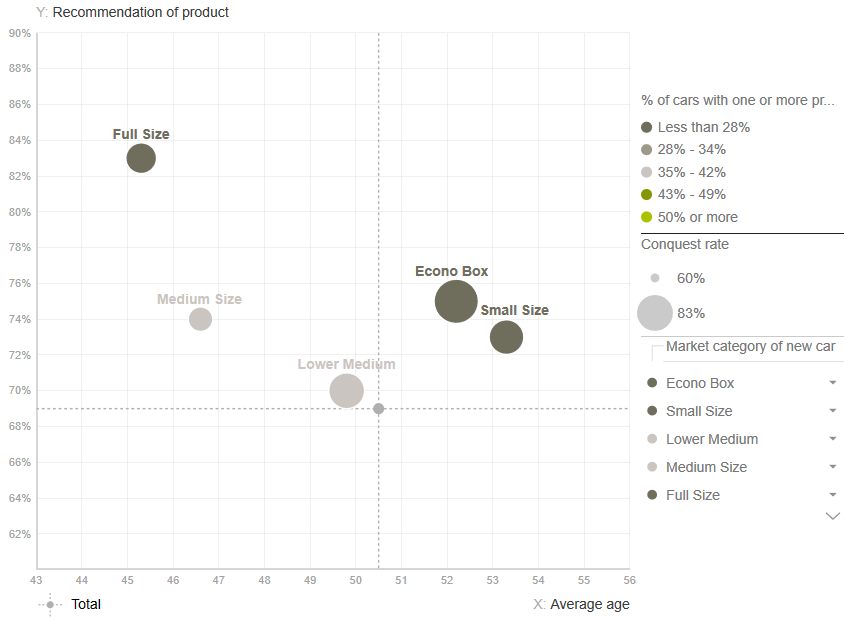
The Thresholds coloring mode option is separated into five ranges.
In the example above, bubbles with values less than 28% are dark gray, and bubbles with values 50% or higher are green.
(No bubble's value is 50% or higher; therefore, there are no green bubbles in the example.)
The threshold range values and colors are customizable under Advanced Settings in the Edit Bubble Color option.
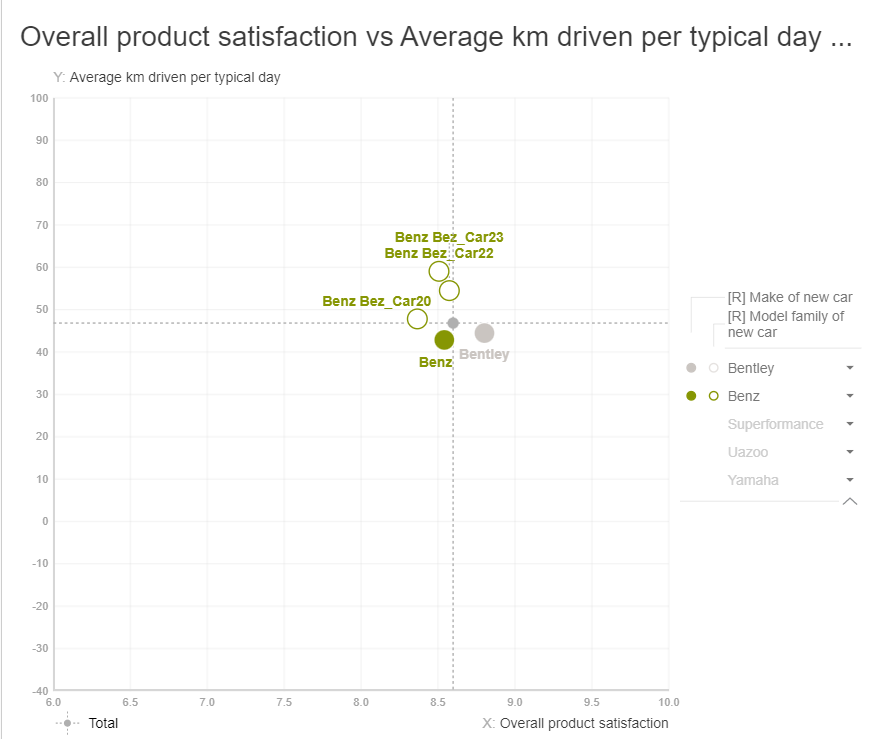
Applying bubble size and color to 2nd category level
When a user adds a second category level by nesting categories in the panel, they can now view the 3rd and 4th dimensions of the scatterplot (bubble size and bubble color) on the chart. It is now possible to apply these settings to a second level of category.