As Query gives you possibility to work not only with Crosstabs but also with a range of visualizations, rows and columns presented below, might be replaced by more specific fields with potential additional rules and underlying logic.
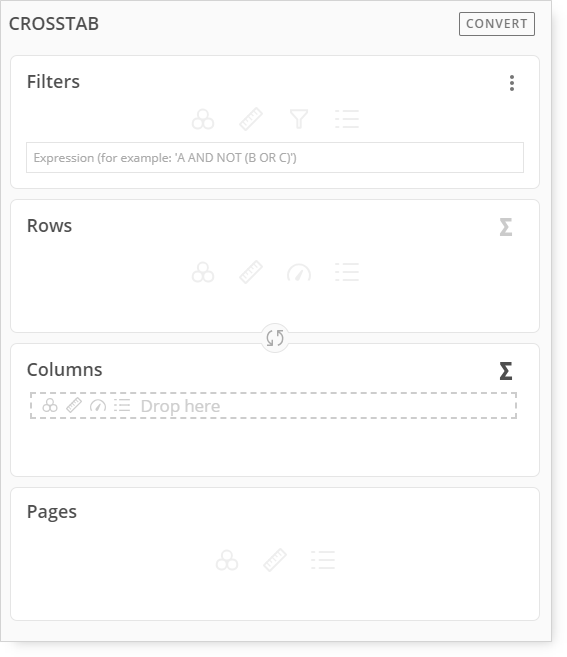
This is an example of Crosstab, where you can see Filters, Rows, Columns, and Pages.
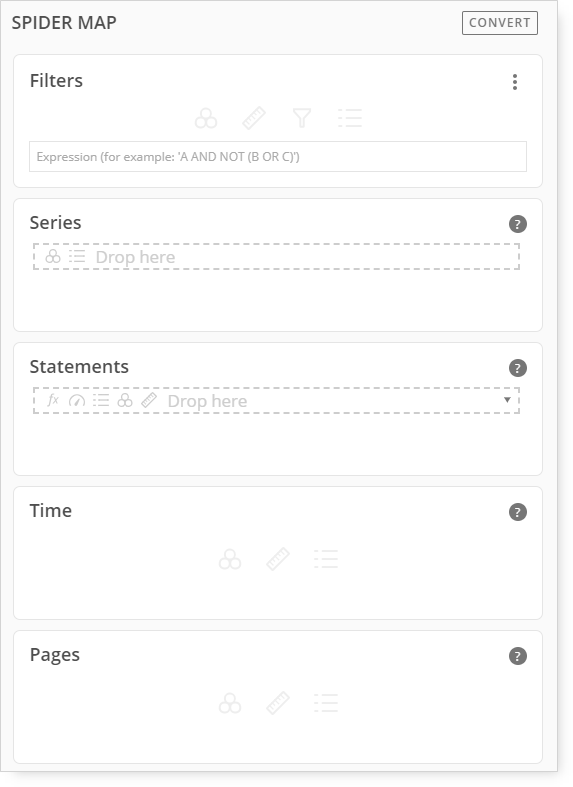
If you select Spider map, you will have Filters, Series, Statements, Time, and Pages available. In order to know more about panels available for a given chart, go to a specific article in the Visualization Optionssection.