Structure Analysis should be used with questions such as Education, Age Groups, Occupation, and other types of single-response questions that sum to 100%.
The following example includes options and settings for a visualization built from Structure Analysis.
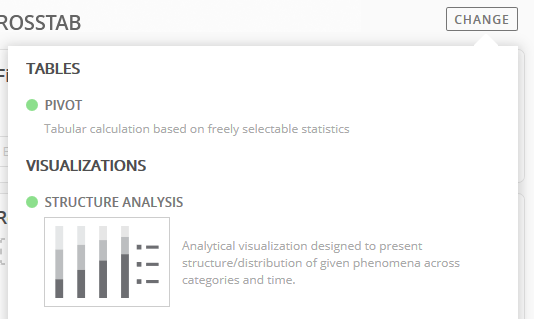
Begin by changing the tab template to Structure Analysis.
Multiple questions can be included in the Categories and Series panels.
Also, an optional filter can be used.
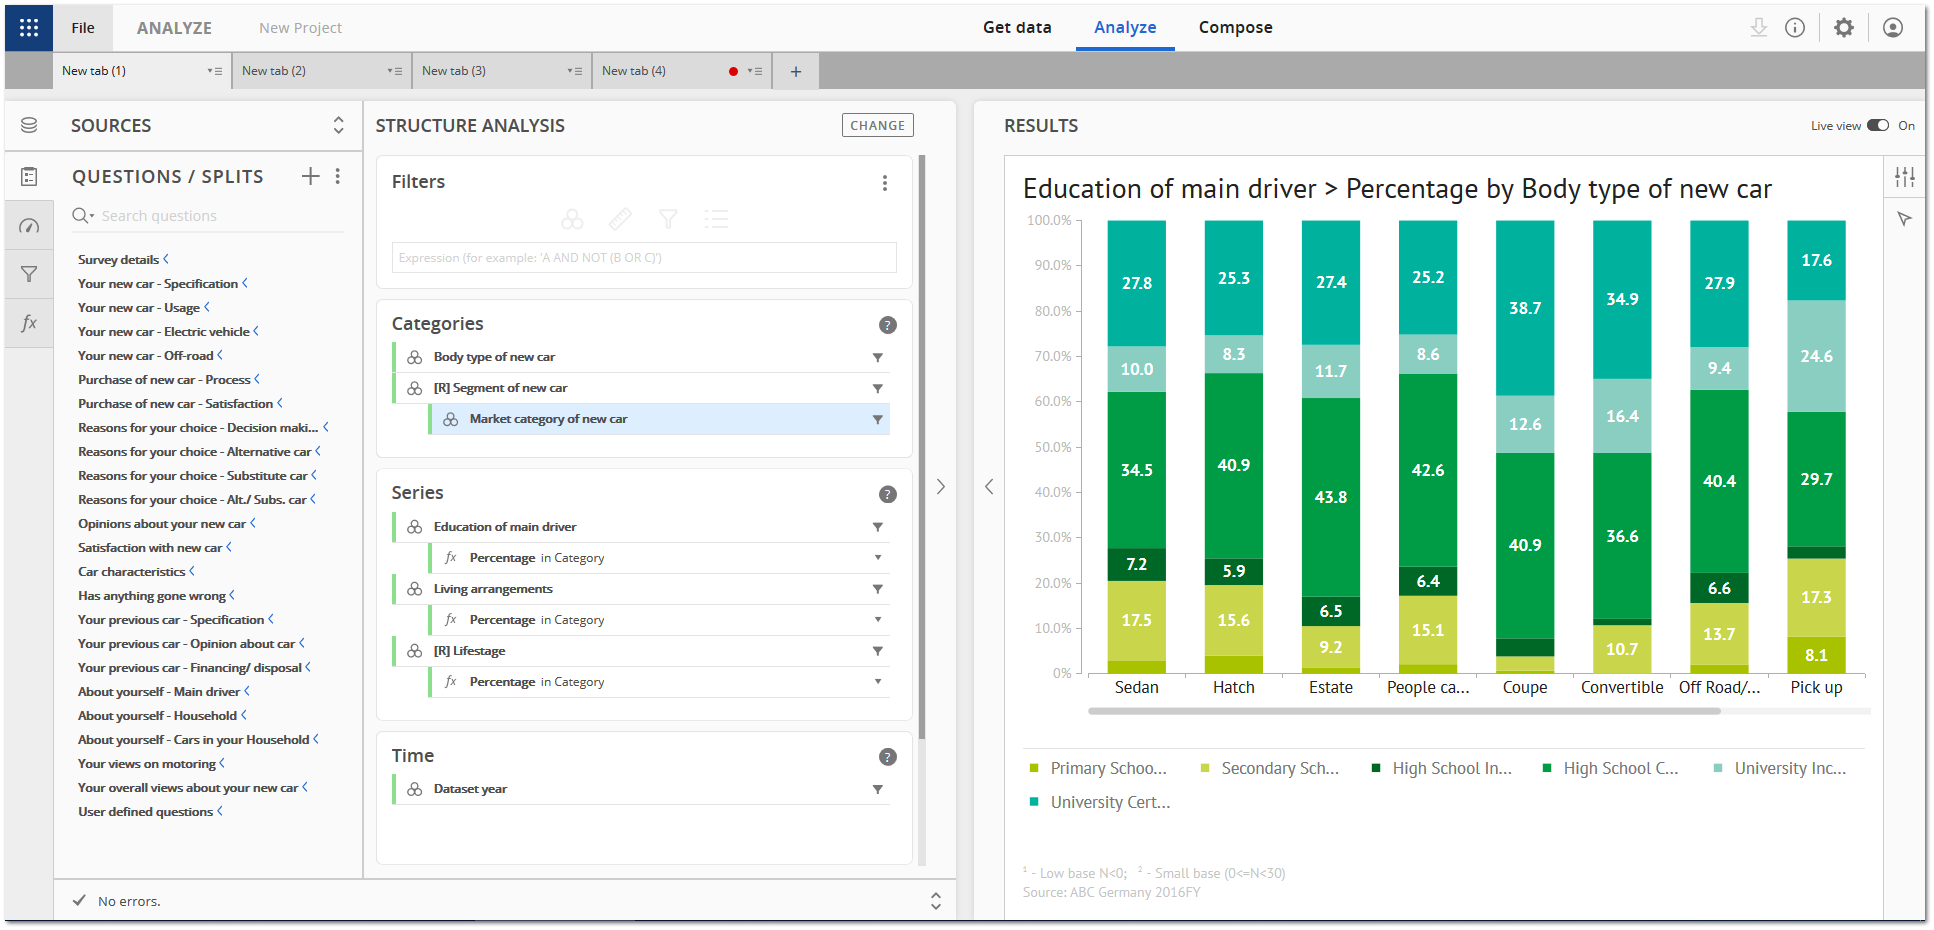
Categories
Body Type of New Car and the Segment of New Car are included in the Categories panel.
A third question, Market Category of New Car is included, but is nested beneath the Segment question.
Nesting questions allows for the analysis of two dimensions. In this case, Market Categories by Segment. (see example below).
Series
Include multiple questions in the Series panel to expand the options for analysis in the data universe.
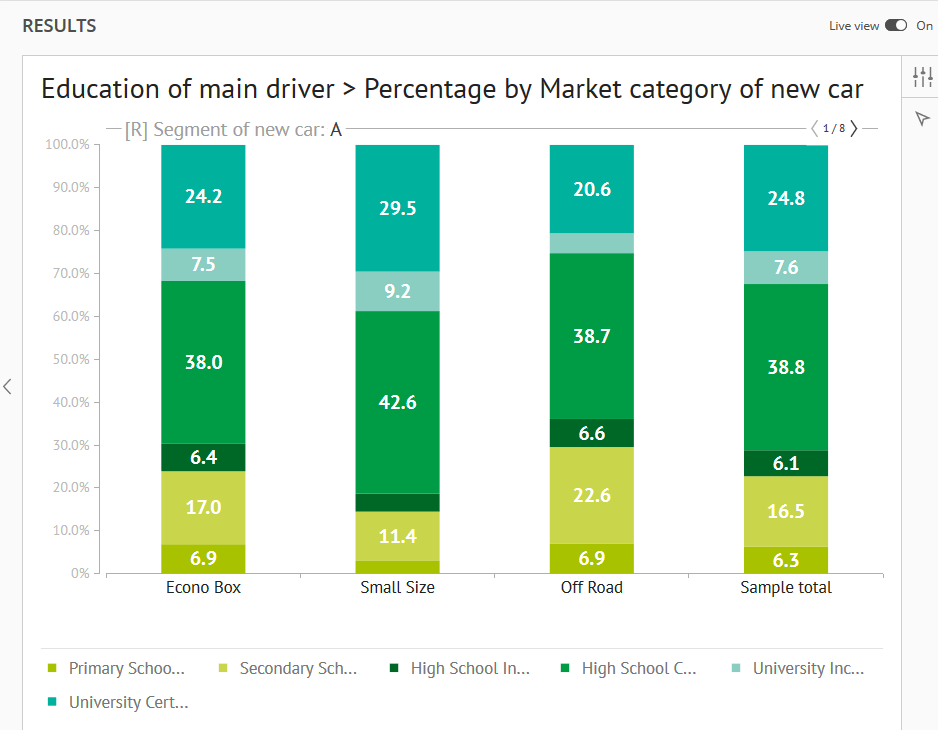
In the visualization on the right, each section of the stacked bars consist of responses from the Education question.
Time
Adding the Dataset Year to the Time panel allows for the trending and benchmarking of data across years. By default the most recent year will be displayed initially. Optional settings can be turned on to introduce multiple years of analysis.
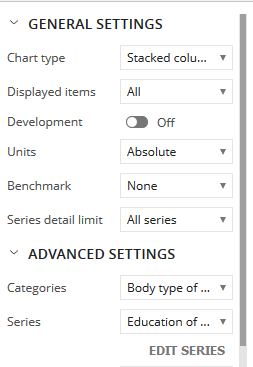
Click the General Settings icon to display the available options.
Category Settings
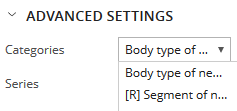
Expand the Advanced Settings options and click the Categories drop-down menu.
In the example above, Body Type and Segment were included in Categories, which makes them available as options in the Categories menu.
Note: Market Category of New Car was also included, but it is not a menu option since it was nested below the Segment question.
Selecting the Segment of New Car menu option changes the analysis from Body Type of New Car to Segment of New Car.
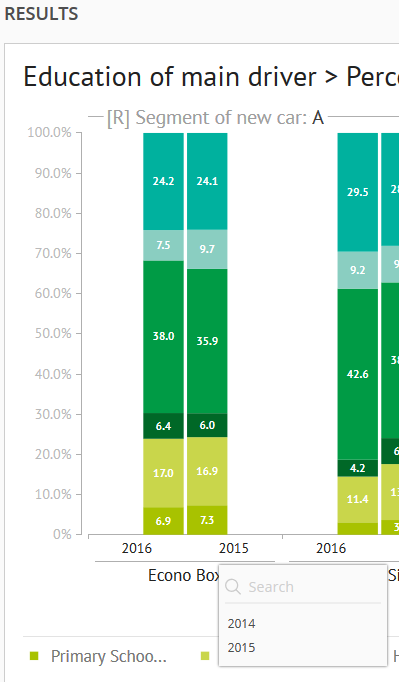
Note the Segment of New Car: A in the chart title and the <1/8> notation.
Clicking <1/8> will advance through each of the segments, so <2/8> will display a chart for Segment B.
Since the Market Category question was nested beneath the Segment question, each Market category that is included in Segment A (Econo Box, Small Size, Off Road) are displayed as bars.
Series Settings
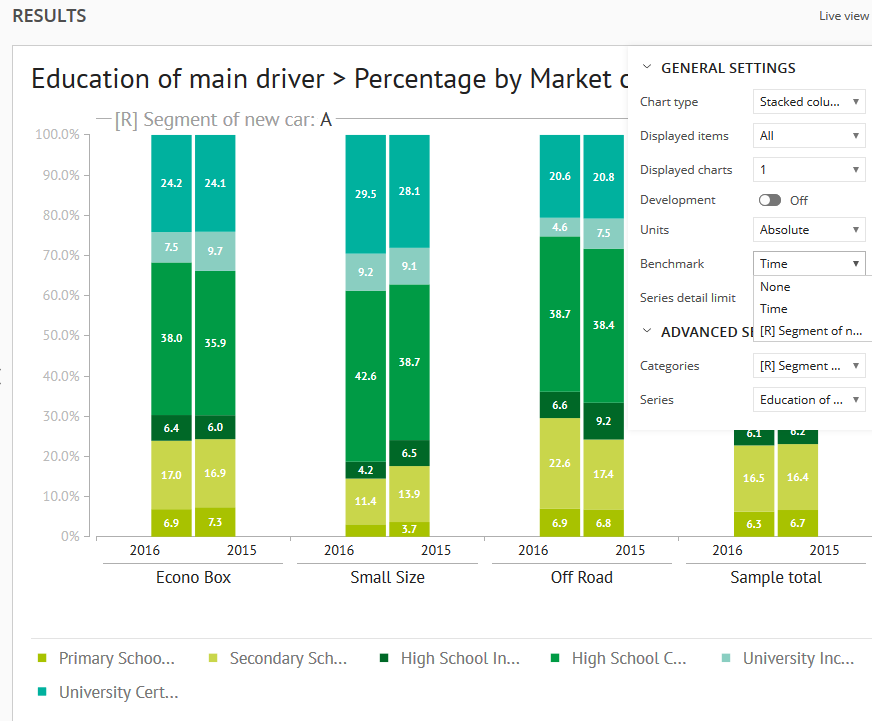
Click the Series drop-down menu.
In the example above, Education, Living Arrangements, and Lifestage were included in the Series panel, which makes them available as options in the Series menu.
Selecting a different option in Series will change the responses and legend of the stacked bars.
Time Settings
During the query setup, multiple years of data were included.
Since Dataset year was included in the Time panel, trend and benchmark options by year are available.
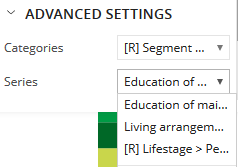
Click the Development slider control to On to display a trend analysis for each year.
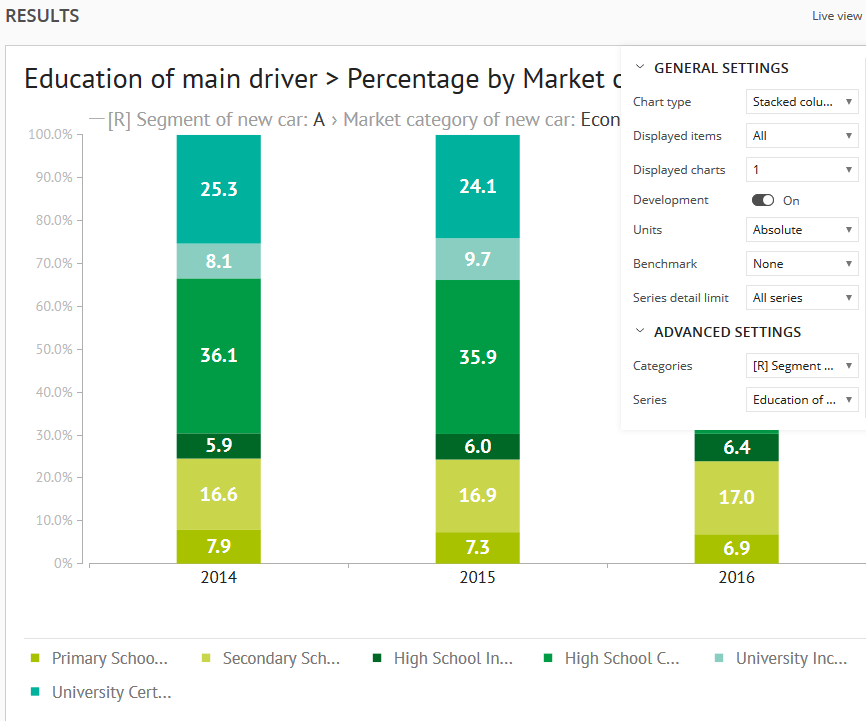
Change the Development setting to Off and click the Benchmark menu to select the Time option.
By default, the Benchmark option includes the time period that is next to the most recent, in this example 2015 is being used, since 2016 is the most recent year.
To specify a different benchmark year, click on the year label. In this example, clicking the 2015 label displays the other available year options.