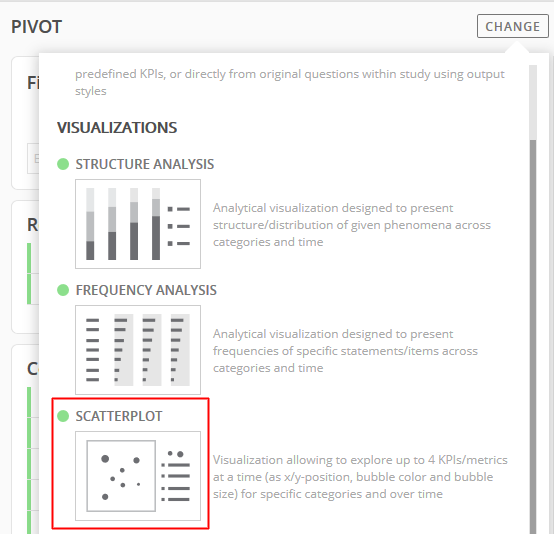
Scatterplot is a visualization that includes bubbles instead of bars.
During setup, the Scatterplot query does not include panels for rows and column output.
Instead, the setup includes panels for Categories and KPIs.
Questions included in Categories appear as a separate bubble per response within the category question.
(e.g. Brand of Purchased Item will show separate bubbles for Brand A, Brand B, Brand C, Brand D, etc.)
KPIs will show attributes for each bubble.
Up to 4 KPIs/metrics can be displayed in a Scatterplot visualization. (X & Y position, bubble color, and bubble size)
The following example includes options and settings for a Scatterplot visualization.
Begin by changing the tab template to Scatterplot.
Multiple questions can be included in the Categories and KPIs panels.
Optional questions can be included in the Filters panel.
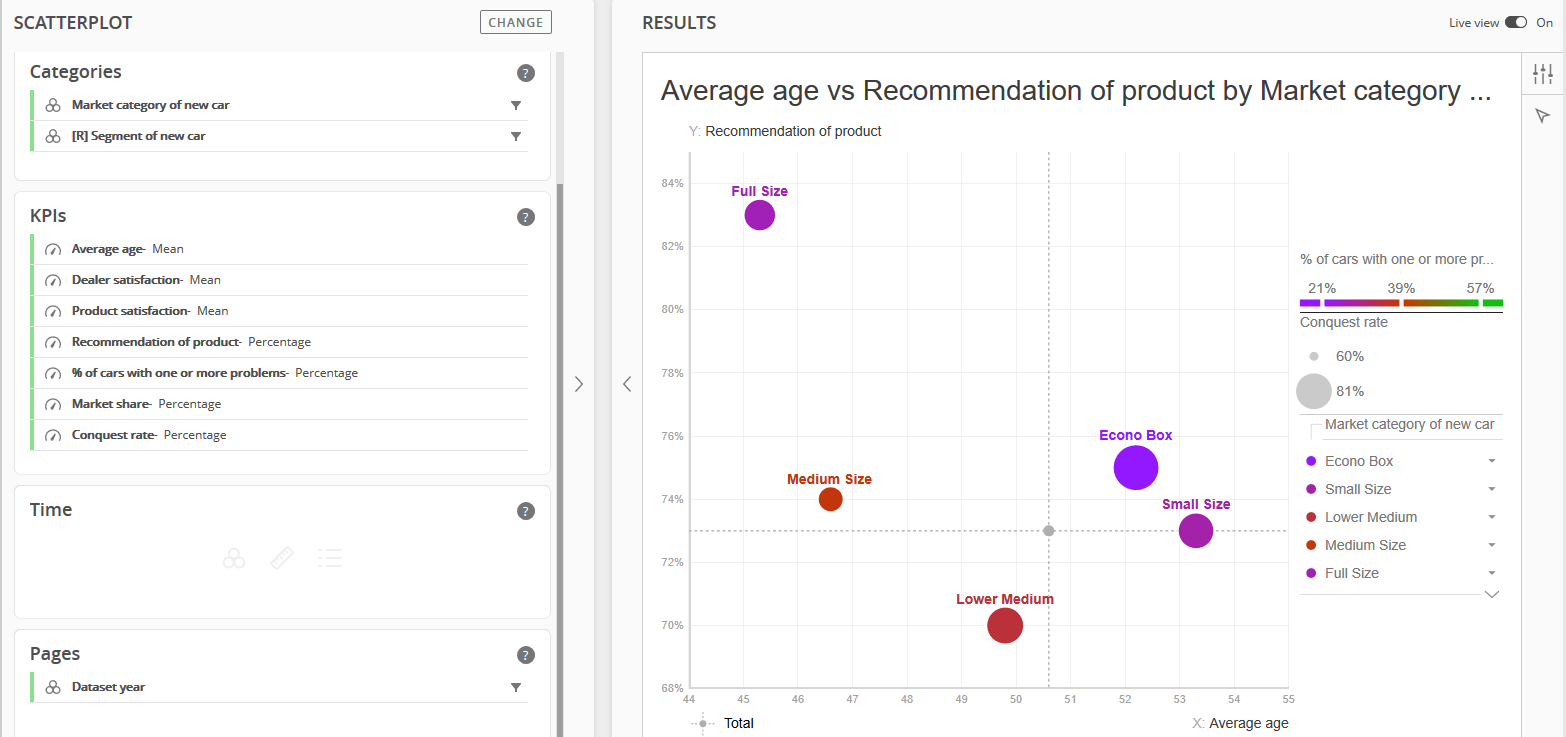
Categories
Market Category of New Car and Segment of New Car are included in the Categories panel.
KPIs
Include multiple KPIs in the KPIs panel to expand the options for analysis in the data universe.
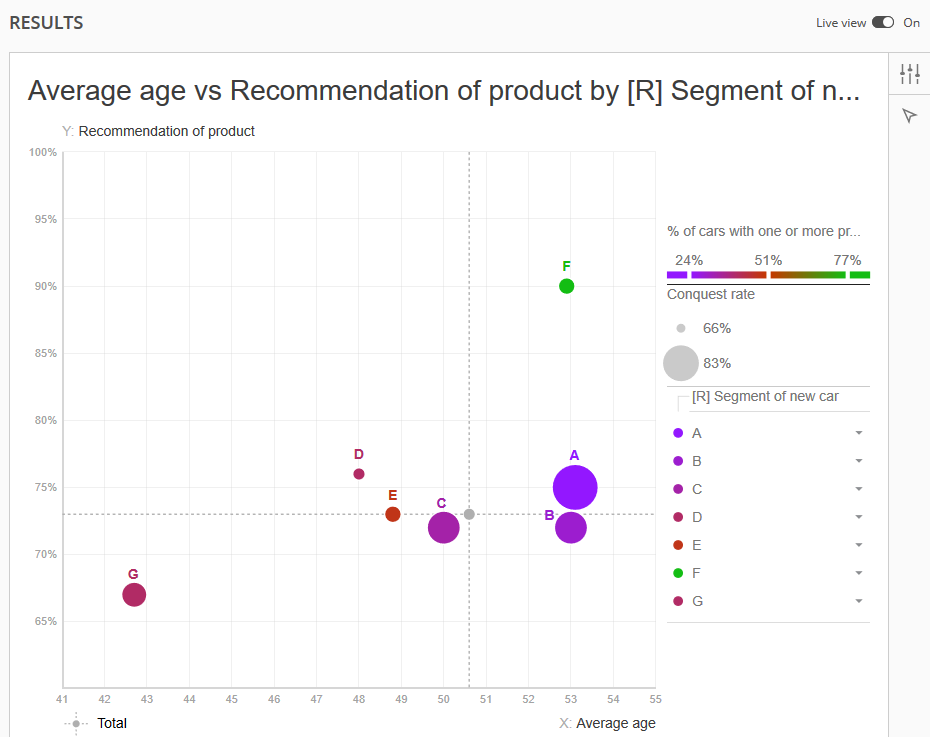
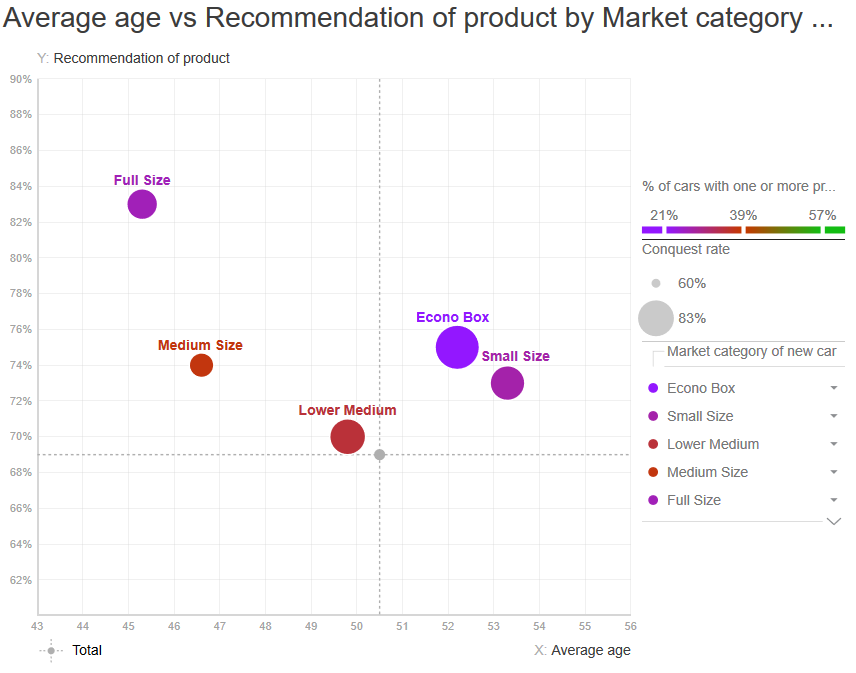
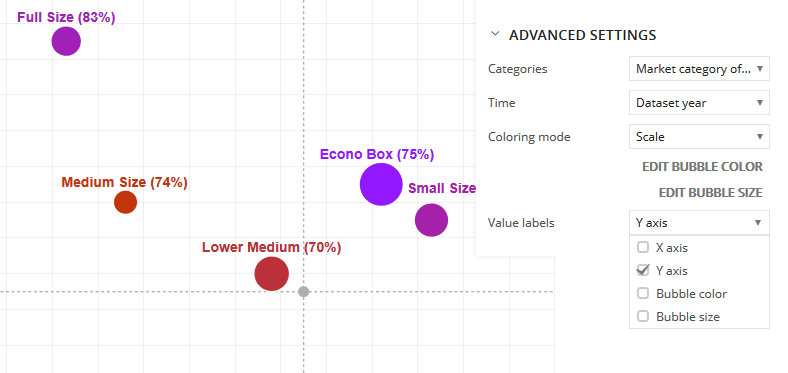
In the visualization above, each Market Category response is displayed as a separate bubble. The KPIs are used for each bubble's position, size, and color.
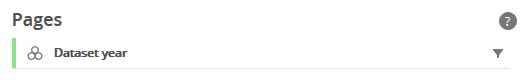
Pages
Adding the Dataset Year to the Pages panel allows for specifying and displaying only a single year of data.
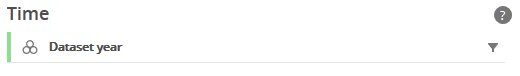
Time
As another option, Dataset Year can instead be included in the Time panel. This will allow for trending and benchmarking of data across years.
By default, the most recent year will be displayed initially.
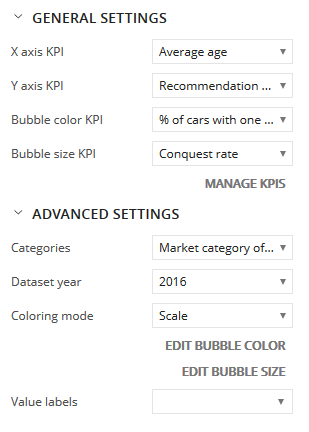
Click the General Settings icon to display the available options.
KPI Settings
KPIs display attributes for each bubble.
Up to 4 KPIs can be displayed per bubble (category response).
KPIs are required for the X-axis and Y-axis, since these are the plot points for each bubble.
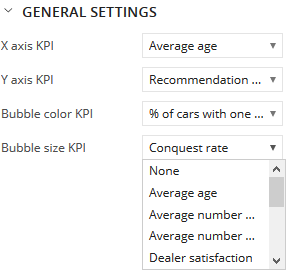
Bubble color and Bubble Size are optional. If displaying bubble color and size is not required, select the None option.
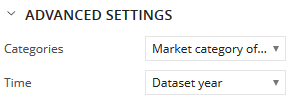
Category Settings
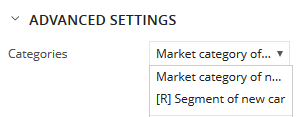
Expand the Advanced Settings options and click the Categories drop-down menu.
In the example above, Market Category and Segment were included in the Categories panel during setup, which makes them available as options in the Categories menu.
Selecting the Segment of New Car menu option changes the analysis from Market Category of New Car (Econobox, Small Size, Lower Medium, etc.) to Segment (Segment A, B, C, etc.).
Pages and Time
During the query setup, multiple years of data were included.
When working with multiple years of data, Dataset year can be included in either the Pages or Time panel.
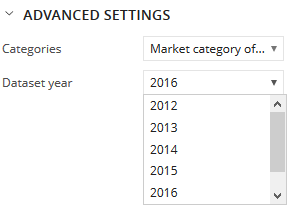
If Dataset year is included in the Pages panel, a selector menu will appear in the Advanced Settings to allow for displaying one year of data in the Scatterplot.
Including Dataset year in Pages will treat each year like a filter. An individual year of data will be shown at one time.
If Dataset year is included in the Time panel, it will appear under the Advanced Settings as a Time selector.
However, when included in the Time panel, there is no additional selection required. By default, the most recent year's data will be shown in the Scatterplot.
In the three examples below, 2016 is the most recent year.
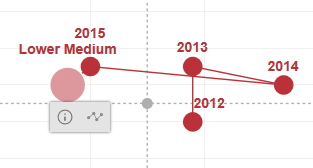
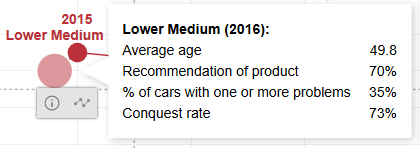
Clicking on any of the bubbles will display additional features.
The optional Time Series setting can be turned on to introduce multiple years of analysis.
Click the information icon ( i ) to display the data points for the most recent year of data.
Value Labels
To show values of the KPIs, expand the Value Labels menu.
Optional checkboxes are available for the four KPIs used for:
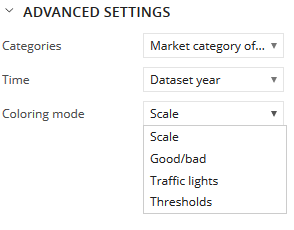
Color Mode
The following bubble coloring options are available:
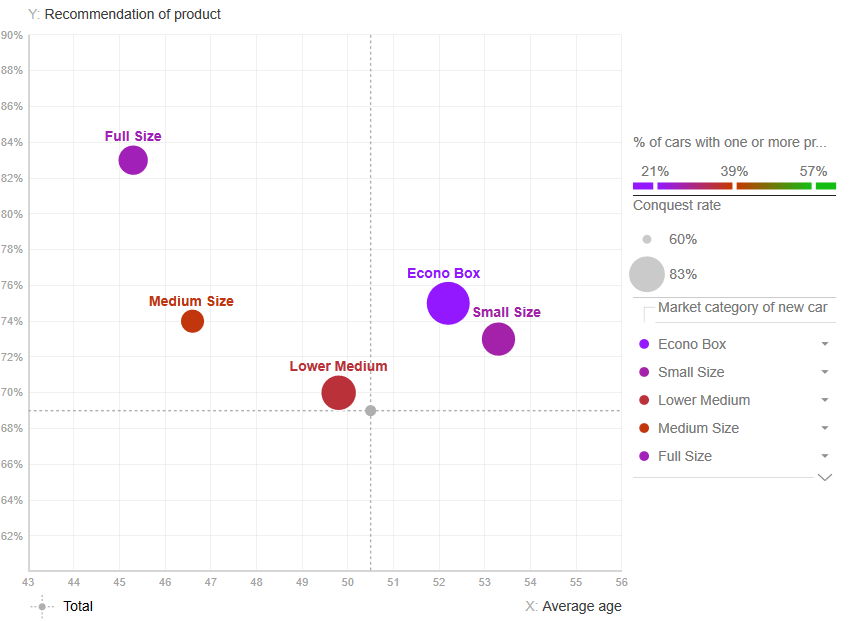
By default, the coloring mode for the bubbles is set to Scale.
Bubble colors will fall within the range of colors.
The colors and range values are customizable in the Edit Bubble Color option, under Advanced Settings.
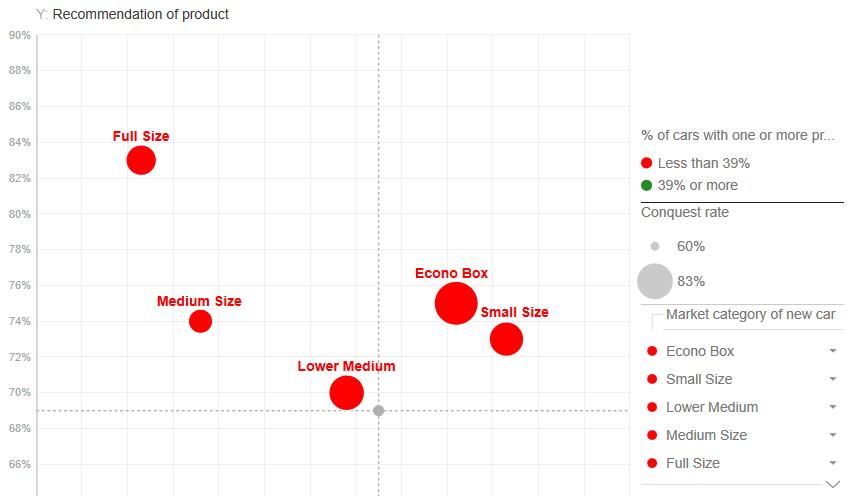
The Good/Bad coloring mode option uses two preset colors (red and green).
In the example above, any bubble value less than 39% is red and any value 39% or higher is green.
(No bubble's value is 39% or higher, therefore there are no green bubbles in the example.)
The range for good and bad values is customizable in the Edit Bubble Color option, under Advanced Settings.
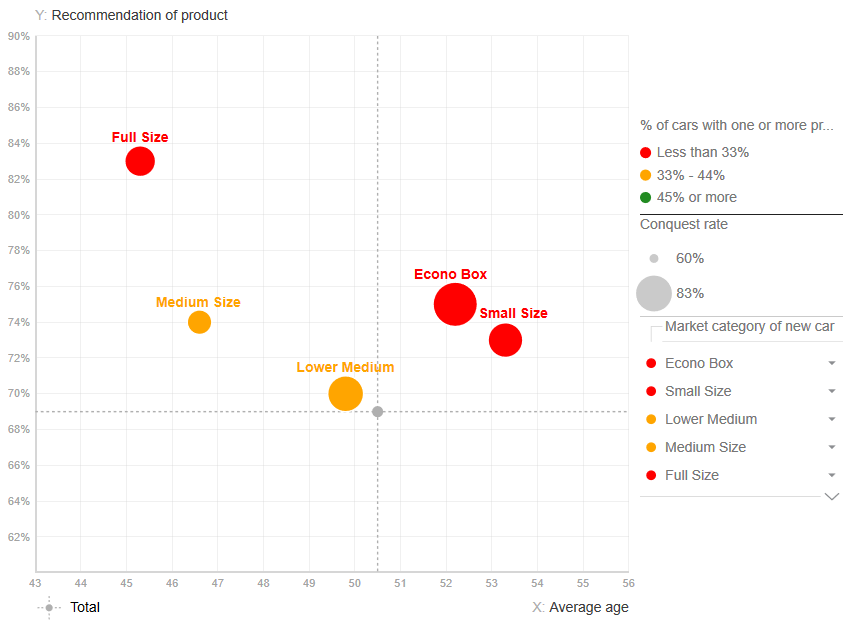
The Traffic Lights coloring mode option is similar to the Good/Bad option, except that Traffic Lights uses three preset colors (red, yellow, green).
In the example above, any bubble value less than 39% is red, any value between 33% and 44% is yellow, and any value 45% or higher is green.
(No bubble's value is 45% or higher, therefore there are no green bubbles in the example.)
The ranges for red, yellow, and green values are customizable in the Edit Bubble Color option, under Advanced Settings.
Bubble colors will fall within the range of colors.
The colors and range values are customizable in the Edit Bubble Color option, under Advanced Settings.
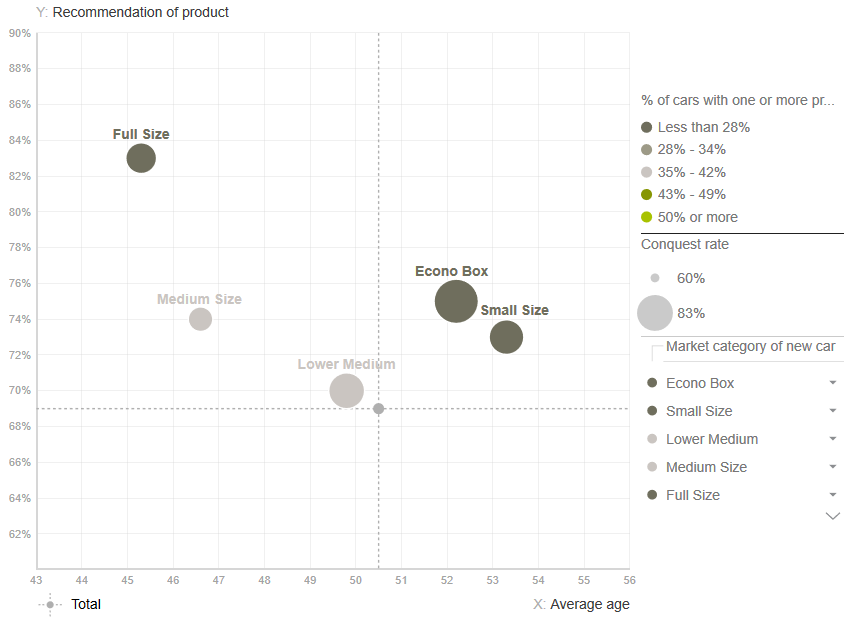
The Thresholds coloring mode option is separated into five ranges.
In the example above, any bubble value less than 28% is dark gray. Any value 50% or higher is green.
(No bubble's value is 50% or higher, therefore there are no green bubbles in the example.)
The threshold range values and colors are customizable in the Edit Bubble Color option, under Advanced Settings.