Merging slides is a new feature that is available in Compose.
Users will find this feature useful when two or more charts or visualizations are included on the same slide.
There are three main uses for merging slides in Compose.
1) Auto Merge - Multiple Charts With The Same Settings
If multiple charts are included on a slide in Compose and the charts have the same slide option settings (e.g. Marital Status: Married, Not Married) the option controls for each individual chart can be combined into a single setting.
This allows the user to interact with the slides more efficiently, since changing a setting once will apply that change to all of the charts on the slide that the setting is linked to.
The user will no longer need to repeat the same change for each chart on the slide.
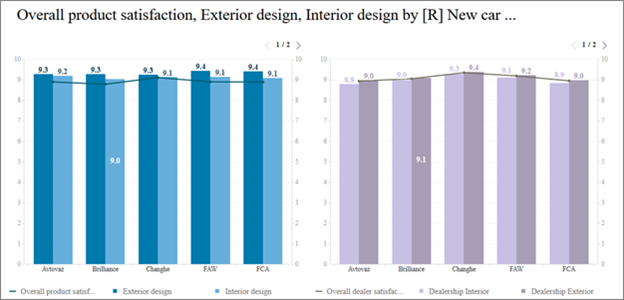
Begin by adding multiple charts/visualizations to a slide.
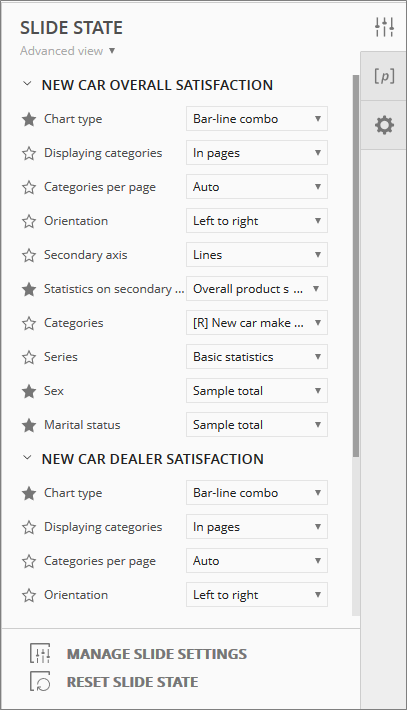
To the right of the slide, click the Slide Settings icon and set the options (drop-down menus) for each of the settings that should be included on the slide.
Click the star icon to pin that setting to include it as an interactive control for users to make their selections in the published slides.
Be sure to scroll down the list and set the options for each of the charts that are included on the slide.
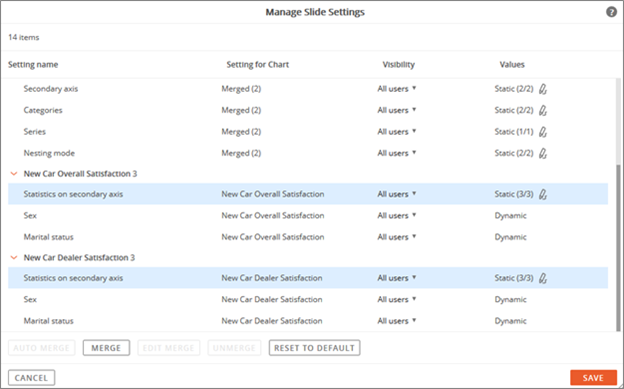
Next, click the Manage Slide Settings option at the bottom of the page.
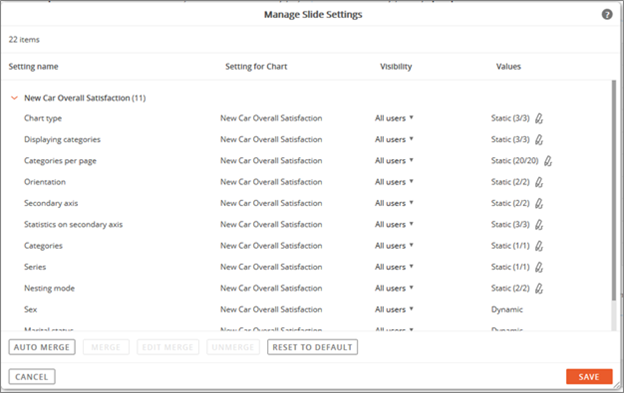
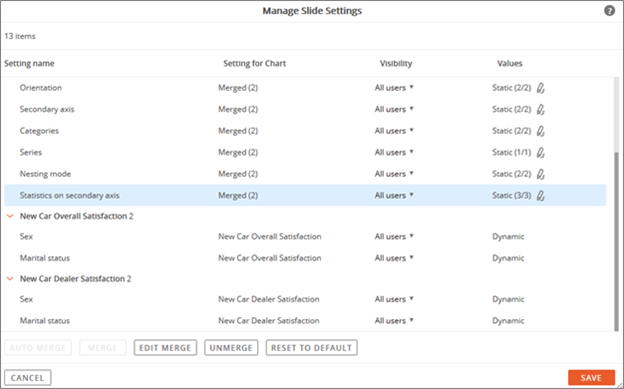
Individual settings will be listed for each chart in the Manage Slide Settings window.
For most cases for merging settings, Auto Merge will be sufficient for combining settings.
Click the Auto Merge button.
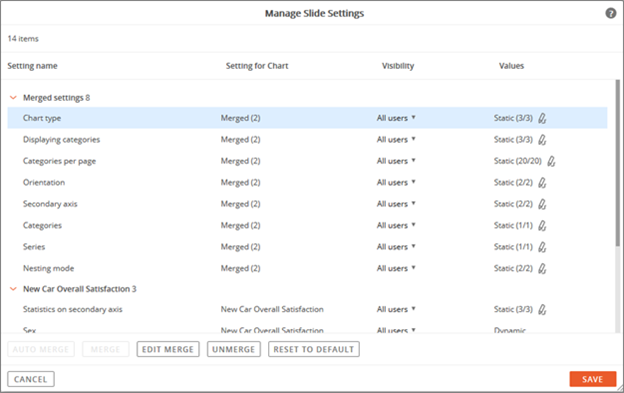
All settings with the same options across slides will be automatically merged and appear in a new section named, “Merged Settings.”
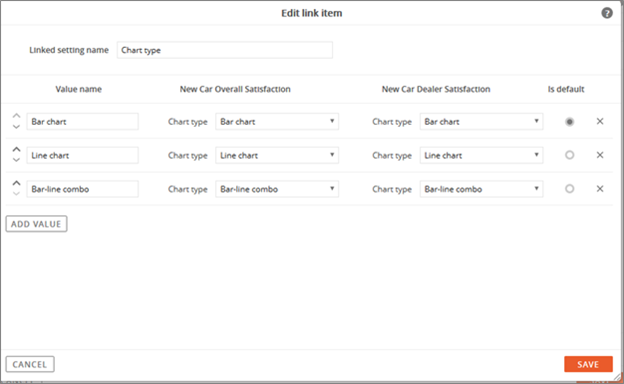
To view the contents of a merged setting, make a selection, then click the Edit Merge button.
The Edit Link Item window will display the new value names for the combined settings and the definitions that make up the new values names.
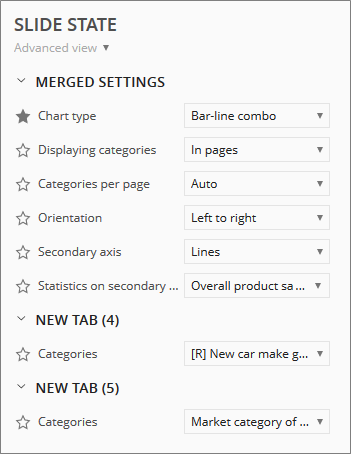
The individual settings that were automatically merged now appear in the new Merged Settings section at the top of the list of control settings.
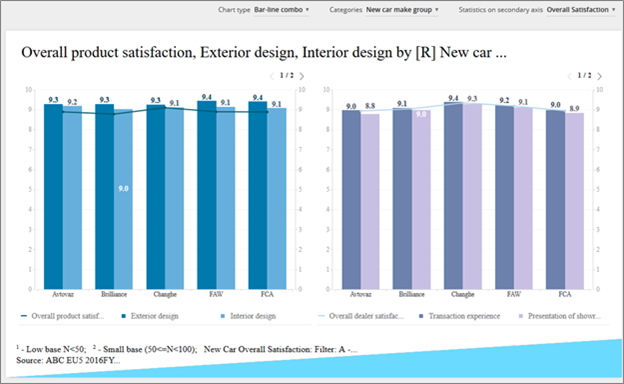
The new merged selector will now control the multiple charts on the slide.
The Bar-Line Combo option is selected as the new merged chart type, which results in both charts displaying the new chart.
2) Merge - Multiple Charts With Different Settings Options
The most common reason for settings to not automatically merge is because there is not an exact match between the settings’ options.
e.g. Chart 1 Setting: “Not Married”
Chart 2 Setting: “Unmarried”
To attempt to merge settings that were not compatible by using Auto Merge, select the settings from the list of remaining unmerged settings.
Then click the Merge button.
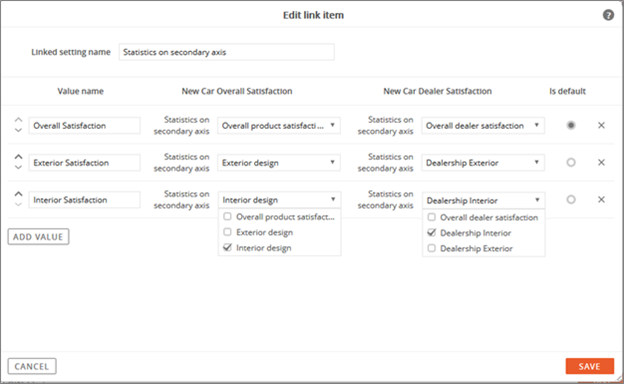
(This example will attempt to merge the statistics on secondary axis settings).
The Edit Link Item will open to allow the user to do the following:
-
Assign a Linked setting name
-
Create a value for each option. This will be the label that appears in the combined setting selector.
-
Choose which option from each setting will be assigned for the merged setting definition. (In this example, “Interior design” and “Dealership Interior” will be assigned to “Interior Satisfaction.”
After completing the merge, the new merged setting will appear in the list with the rest of the merged settings.
The merged secondary axis selector can now be used in the slide. This one selector will now control both charts on the slide.
3) Merge - Settings From Different Chart Types
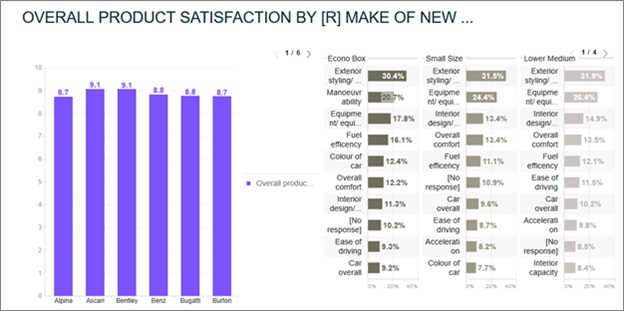
When working with different types of charts on a slide, the settings most likely will be different.
Between the chart settings below, there are not many that share common controls.
The Merge feature can still be used.
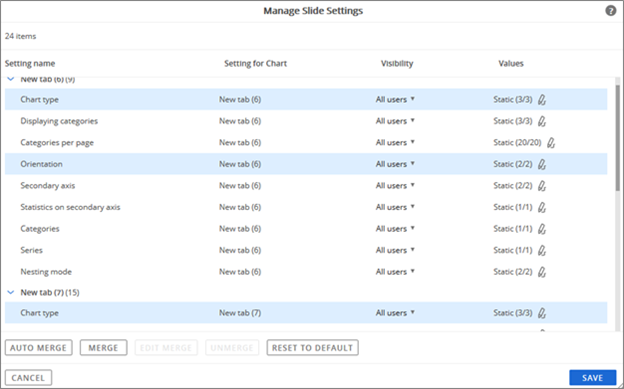
Click on Manage Slide Settings and select settings to manually merge.
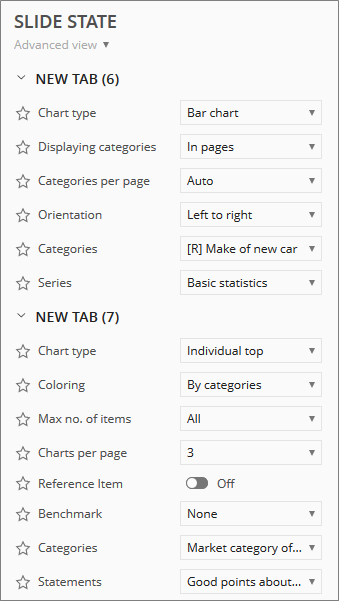
In this example, Chart Type and Orientation are selected for the left chart and Chart Type is selected for the right chart.
After selecting the settings, click the Merge button.
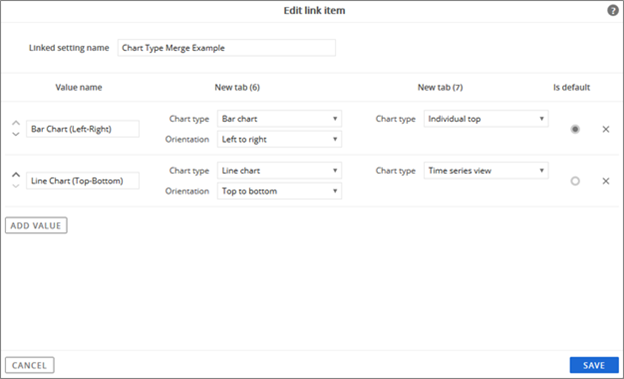
Click the Add Value button to create new menu entries.
These will act as listed options when a user clicks the drop-down menu for a selector control.
-
Value Name is the description that will appear in the menu list
-
Chart Type and Orientation are the display options for chart 1 (left chart on the slide)
-
Since only one setting was previously selected in the merge process for Chart 2 (right chart on the slide), only Chart Type is part of the merge definition.
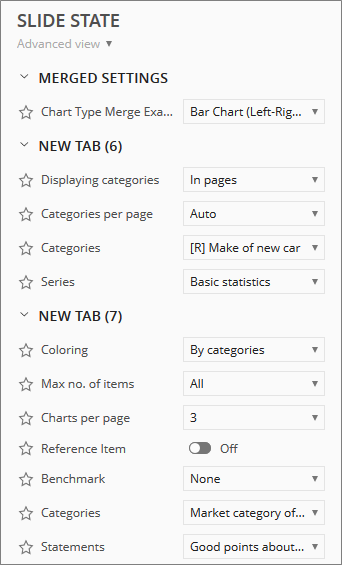
After saving the new merge definitions, a new Merged Settings section will appear at the top of the settings list.
Since the Chart Type and Orientation settings were used as part of the new merge definition, those individual settings no longer appear listed under New Tab (6), which is the left chart.
The same applies to Chart Type for New Tab (7), which is the right chart, since it is also used in the new merge definition.
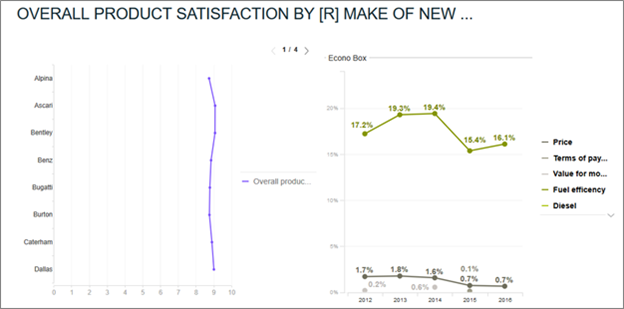
Toggling the menu options in the new Merged Settings will change both slides, even though they are different chart types.