Formatting Visualizations
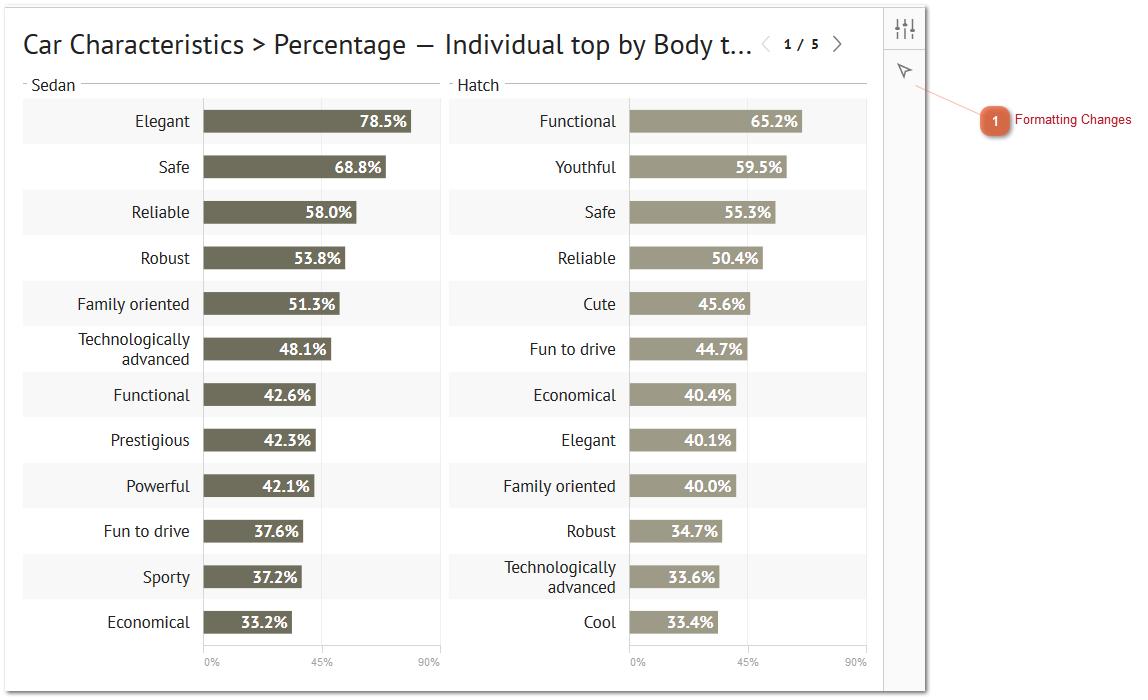
 Formatting ChangesAfter creating a visualization, formatting changes and options are available using the arrow icon.
|
|
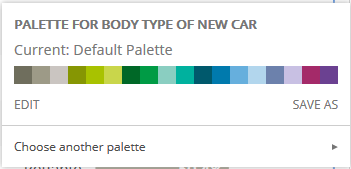
Select different colors for the visualization by using the color palette.
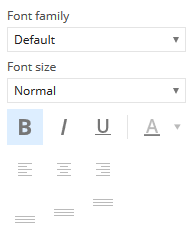
Change the font style, size, and alignment.
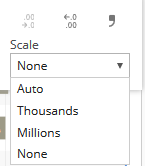
Increase or decrease the decimal precision or adjust the scale.