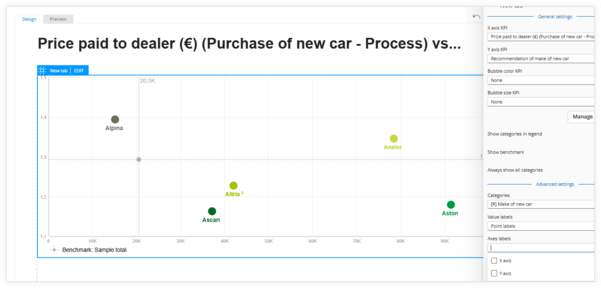
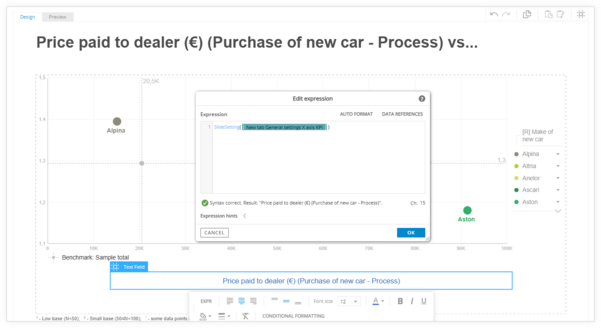
If you are using visualizations on the page, it can be helpful to take some settings from them and place them directly on the slide. The SlideSetting function lets you do this. For example, we disabled the axis labels in the Scatterplot and instead added custom text fields with the X/Y axis selections from the right ribbon settings. This approach allows for more control over formatting and positioning, which wouldn't be possible with the default axis labels.