Expressions are a set of functions available in Reports, which allow you to retrieve and transform the data. These functions can be used to create a user defined question (UDQ) in the Query section and can also be used in Compose, where they allow connecting slide objects to data from Query. Here, we will focus on the use cases for expressions in Compose only.
In Compose expressions can be used:
In Grid cells/ dynamic rows and columns;
In Data Widgets;
In text boxes (including slide titles and text added inside shapes);
In dynamic images;
In conditional formatting.
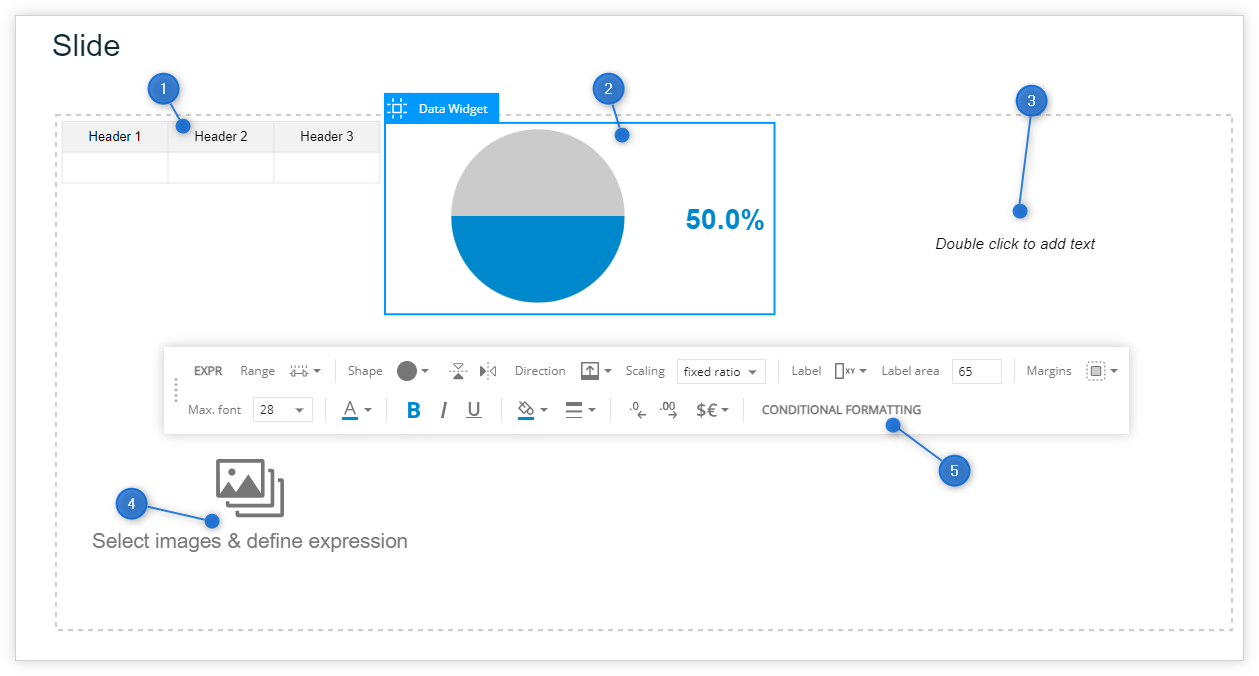
See all the components together, where the expressions can be used.
A comprehensive example of an expression and its usage can be observed when SELECT QUERY is used to populate the Grid with data, where there is no need to manually build any expression. You can see when editing such a Grid that every value is included as a formula. If no nesting is present in the original Query, there are additional dynamic rows and columns definitions included which also use expressions. We break down those formulas in SELECT QUERY section.
In the case of nesting, row/ column labels are added as plain text, but each value cell is a formula. In the case of Query without nesting, responses from used questions are also included as formulas and only some specific headers (e.g., statistic name) are plain texts. The functions used for this definition, as well as a lot of other ones, are available for everyone and can be used to manually build either simple or complex expressions to feed slide objects with data.
Before we jump into describing available functions, see where you can find some additional information on how to use each of them. There are now 3 places available with additional insights:
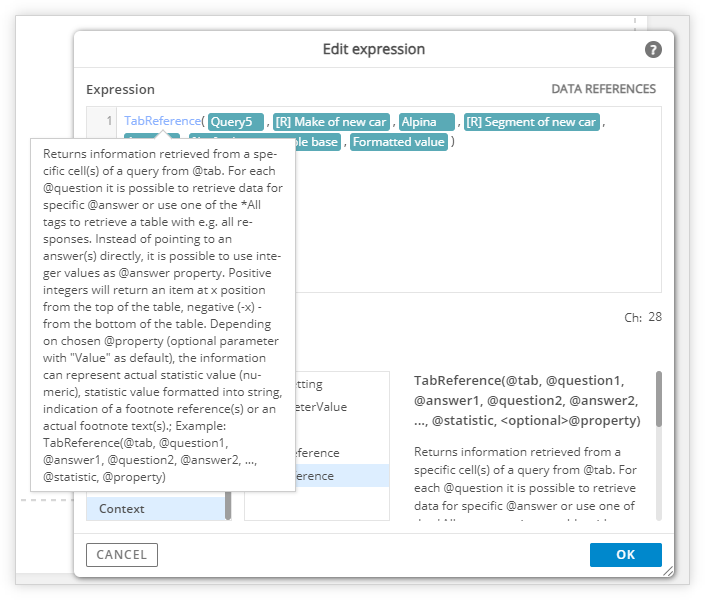
Within each “Edit expressions” window, there is a section called “Expression hints”. It provides a list of all available functions, grouped based on what they do. Clicking a function provides a description on the right side. Note that double-clicking the function will insert it into the expression.
The same description will appear on mouse hover on the function name within the existing expression.
3. Lastly, you find a user guide page listing all expressions here.
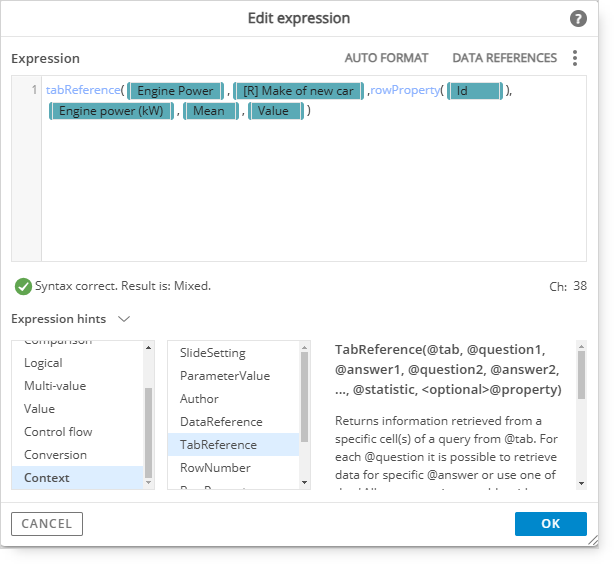
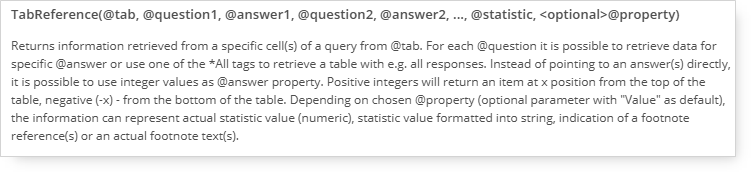
As you can see from the SELECT QUERY examples, the most important function from the perspective of retrieving data from Query is the TabReference function. It allows the user to retrieve the value(s) of specific data point(s), as well as some additional properties of the cell. The full description of the formula is as follows:
Breaking this down into pieces, you can see that following steps might be necessary when defining TabReference:
Specify the tab from which you want to take the data [tab from query];
Provide necessary information for each value that you would like to include in your expression. For every question you will need to select its value [category question1, questionvalue1]. If you have more questions nested in your Query then repeat this step depending on the number of nested structures;
Refer to the question with statistic and statistic value [question with statistic, question with statistic value];
Provide the name of the statistic to which you are referring;
If you have a property other than value (e.g., response label or significant difference indicator) to mention then it can be included at the end of the formula.