RankOf and Count Function
One of the most common needs in that area is to include ranking positions on the slide.
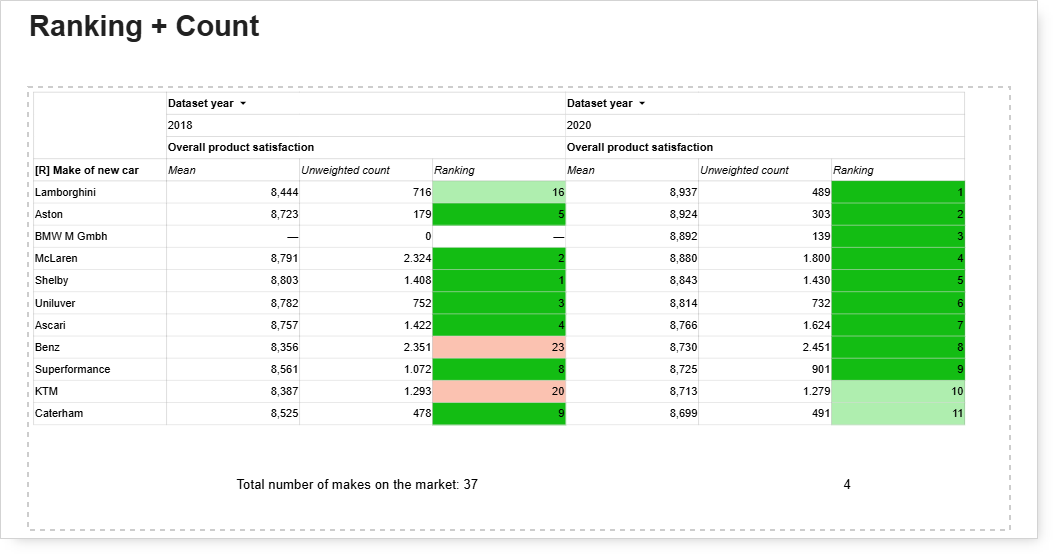
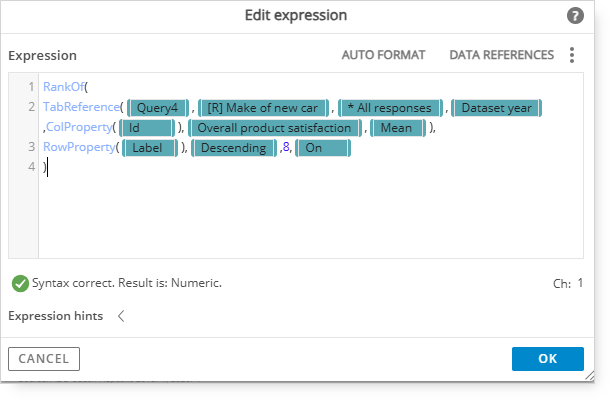
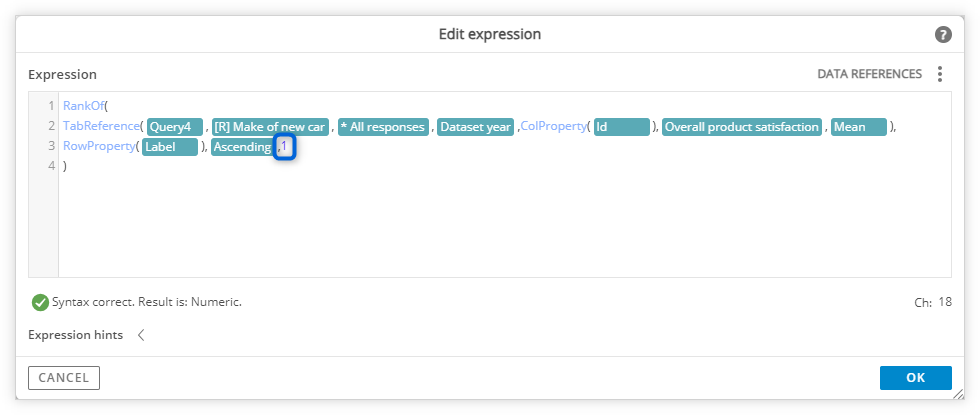
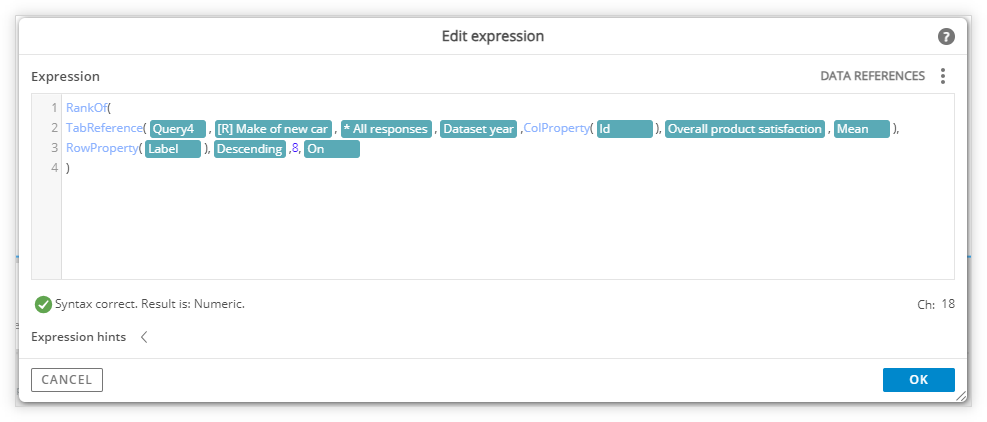
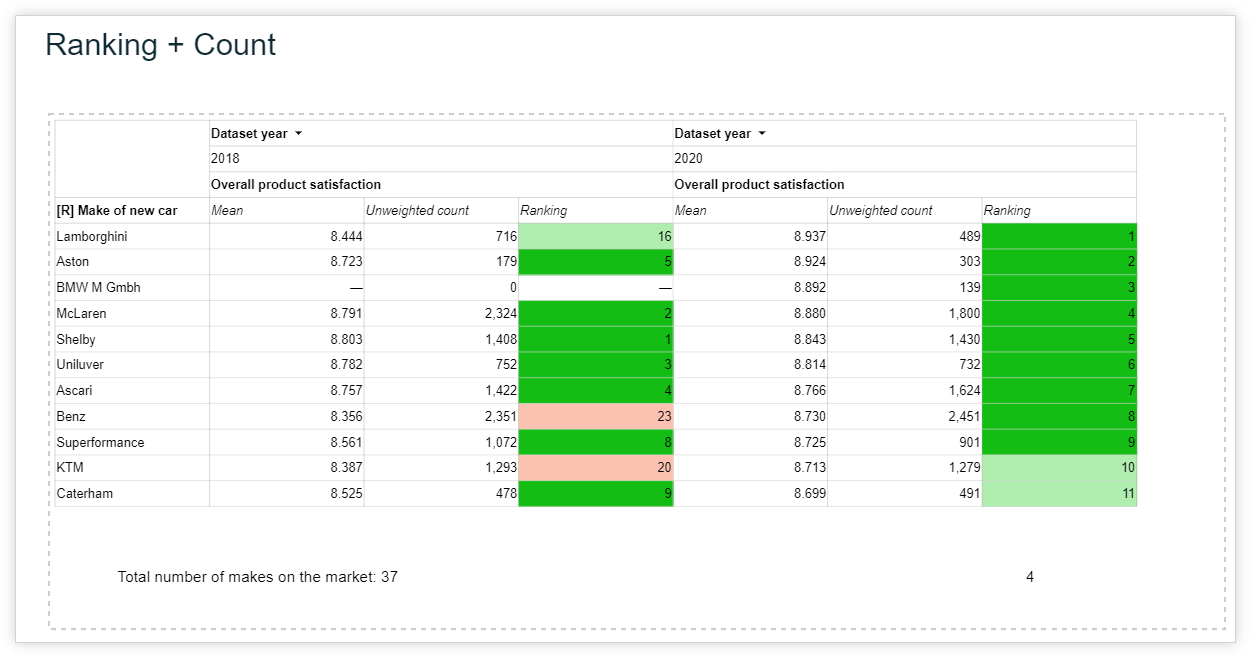
In the example above, we can use the RankOf function to fill in the ranking positions. It does not require the input Table to be sorted and returns the ranking position of searched text (in this case - the searched text is RowProperty(label), so label is determined dynamically for each row within the dynamic row) based on provided values. As we use dynamic columns, we need the formula with reference to the ColProperty(label) filled in just once.
However, prior to inserting the RankOf function, the grid needs to be prepared. First of all, add the Grid Widget to your slide, then insert data from a specific query. Finally, add the columns where the ranking positions will be displayed. In order to do that you need to go to the dynamic column top bracket and add the columns there.
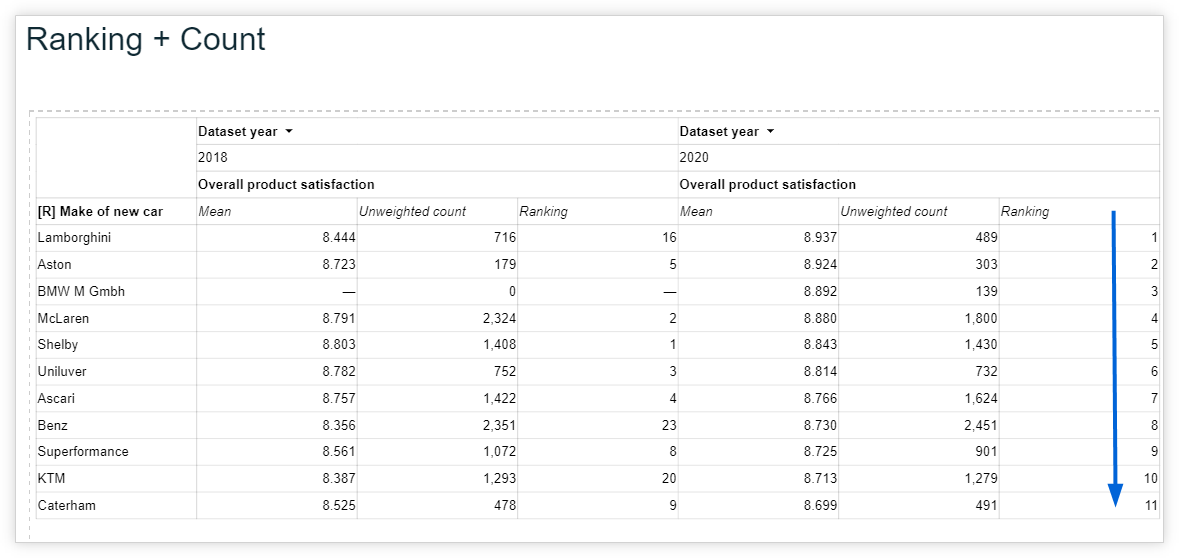
By default, the ranking is calculated based on the descending values, without any rounding and without a dense ranking rule. Each of those 3 options can be changed by filling in additional optional properties within the formula. Let’s sort the Grid by the value in the most recent period and increase precision of displayed numbers for clarity and then see the effect of the additional options.
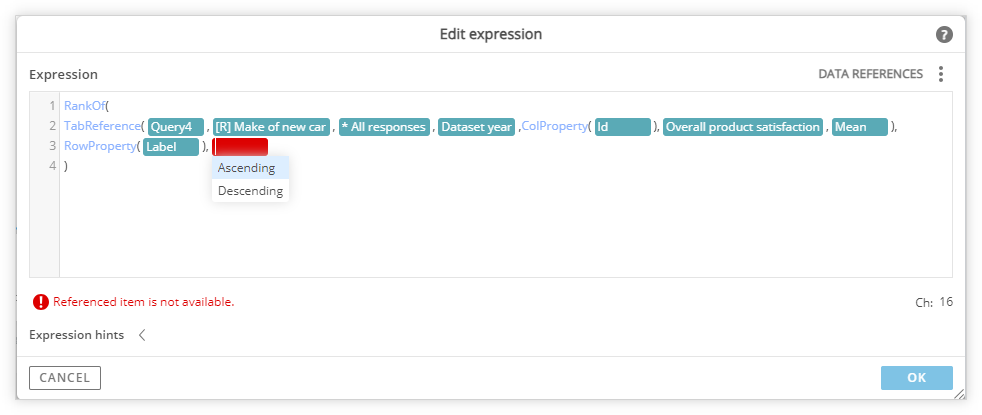
We can calculate ranking based on ascending values:
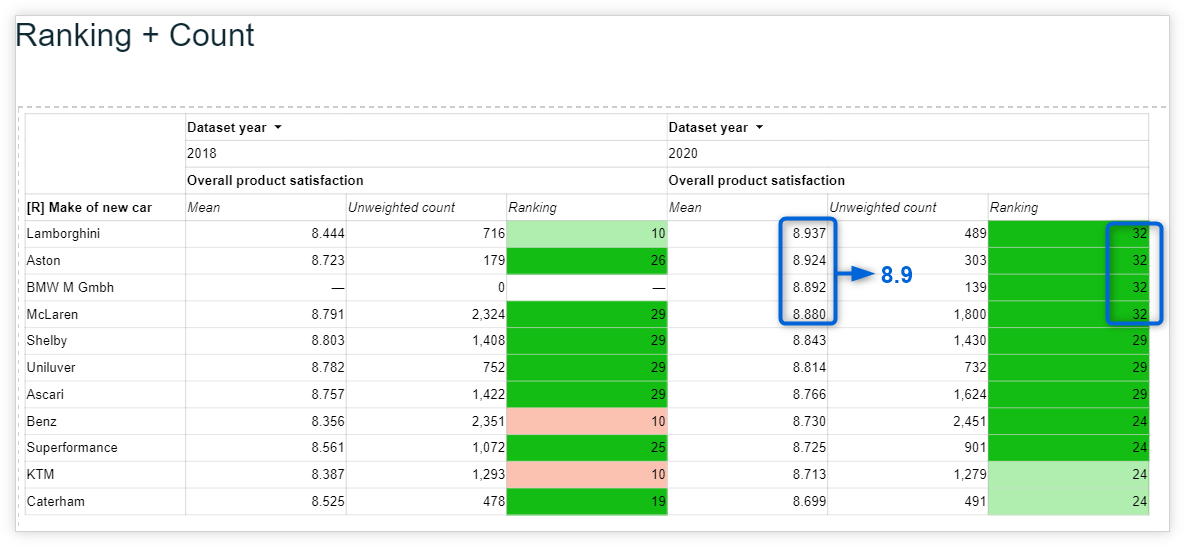
We can also decide to base the ranking on rounded values by providing the integer value for the rounding rule, e.g., 1 if we want ranking to be calculated based on values rounded to one decimal:
See how this influences the results:
Note that since Analyze provides unrounded values with a precision of 8 decimal places, 8 is a default value and is, in fact, equal to “unrounded.”
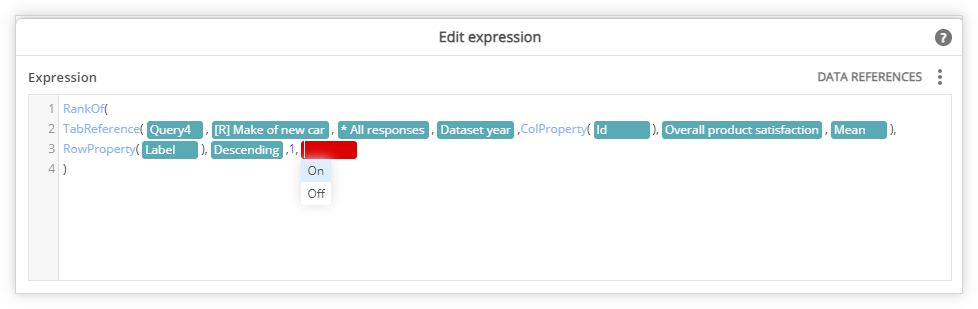
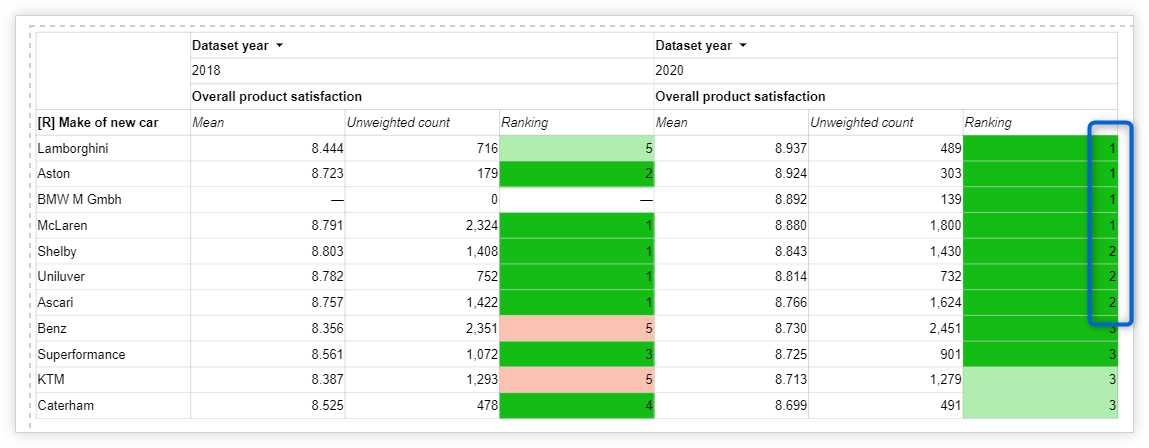
We can also enable dense ranking rule (that is, ranking as, e.g., 1-1-2 rather than 1-1-3 in case of equal values):
It is important to understand that the optional properties must always be provided in the given order. This means that if we need to adjust the value for dense rank setting only, we need to fill in sort and rounding rules first, even if we just reproduce the default behavior.
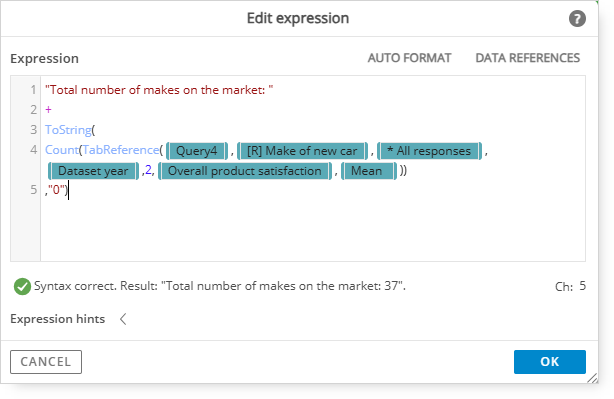
RankOf is one of the functions that provide additional row-specific information based on the full Table input. Some functions aggregate information from the whole input Table to provide one specific value. An example of this is the Count function. It returns the number of rows provided within the input Table. We can use it, for example, to include information about the total number of makes in the results (note that the result needs to be converted to a string if we want to concatenate it with other text):
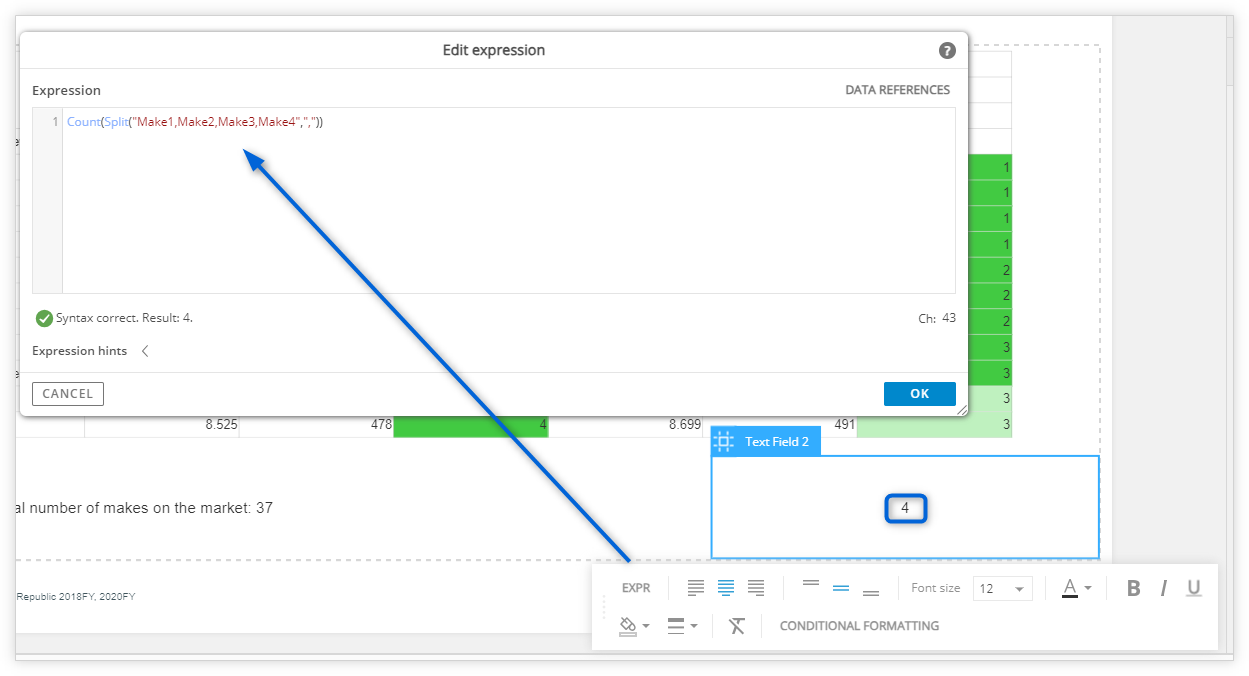
The Count function can also be used for multistring data input. Let’s say that we have a text which includes several names split by commas. We can use a combination of Count and Split functions to get a number of names included in the text. In this case, the Split function returns a list of strings created by separating the input based on commas. The Count function can then calculate the number of strings in such a list.
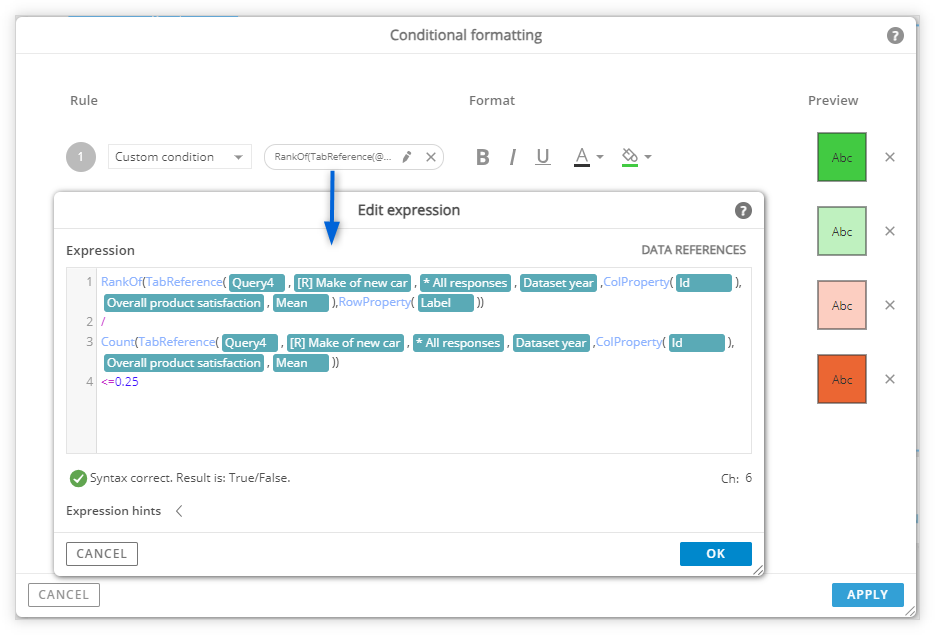
A combination of RankOf and Count values can be used, for example, to include quantile-based formatting in the Grid. If we take RankOf/Count for each row, it provides, in fact, quantile information. This can be used in conditional formatting to format each row based on the quartile it is in. Let’s say the top 25% should be dark green, light green, and light red, and the bottom 25% should be highlighted in dark red.
If Rank/Count < 0.25, this means the row is ranked within the top 25%. The next rules follow the same logic, just with different thresholds. Note that conditions are resolved sequentially, so it is important in which order we will place them. In our case, if the first condition is <=0.25, the second one can be simply <=0.5 rather than “>0.25 and <=0.5” since in cases <=0.25 the first condition will be applied anyway. See how this influences the Grid (conditional formatting is applied on the ranking column):