The full version and functionality are available for crosstabulation of data.
This is the default view for most users.
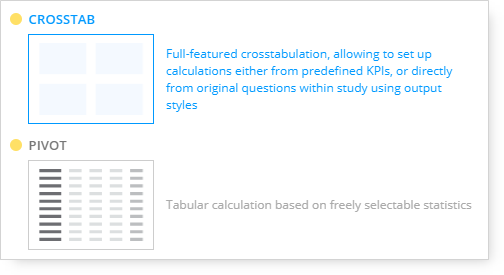
The crosstab template is intended more for use by traditional analysts who want to produce spreadsheet tables that include formatting such as unweighted sample total counts and formatted subset totals in addition to percentages or means.
Pivot
A single, specific statistic/calculation/count is defined and used for each Pivot question. Pivot does not use the format output styles feature that is available in the Crosstab template.
When building queries intended for visualizations (Structure, Frequency, Scatterplot), use Pivot instead of Crosstabs. Pivot allows for more control, which is necessary because a visualization needs to know precisely what statistic should be plotted for specific data points. The output styles used by Crosstabs usually need to be more specific.
With Crosstabs, multiple calculations and formats are often associated with a single crosstab format (e.g., percentages used in Crosstabs typically include percentages, Sample Total, Subset Total, and Unweighted Sample count). When building a visualization, it might be unclear which of these should be associated with the data to plot. Instead, Pivot has just a single main statistic associated with each question.