Analytical Visualizations
Query provides you with self-authoring visualization options. The analytical and interactive visualization capabilities offer much more than just a chart gallery.
Query allows you to take a different, more analytical approach when working with visualizations.
Query offers several different visualizations. You can either start working with them immediately by clicking the Convert button and selecting the visualization you need, or you can create a basic crosstab. Then, if you decide to present the data in a specific visualization, you can do it by selecting the Convert button.
Converting Existing Queries
In order to convert existing queries to a different query type please select the Convert button.
Here are some common uses for this scenario:
-
A crosstab query is already populated with data, but visualizations are needed;
-
A query is already built for visualizations, but additional crosstab functionality is necessary;
-
Additional questions are added to the query that will change the required analysis or visualization (e.g., need to change a Structure Analysis to a Scatterplot).
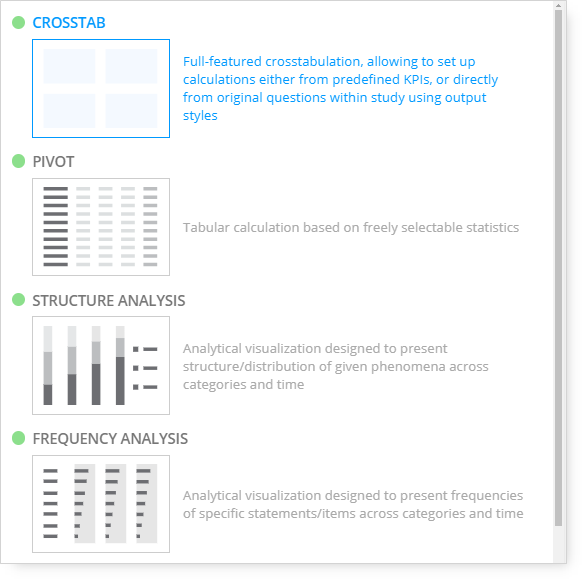
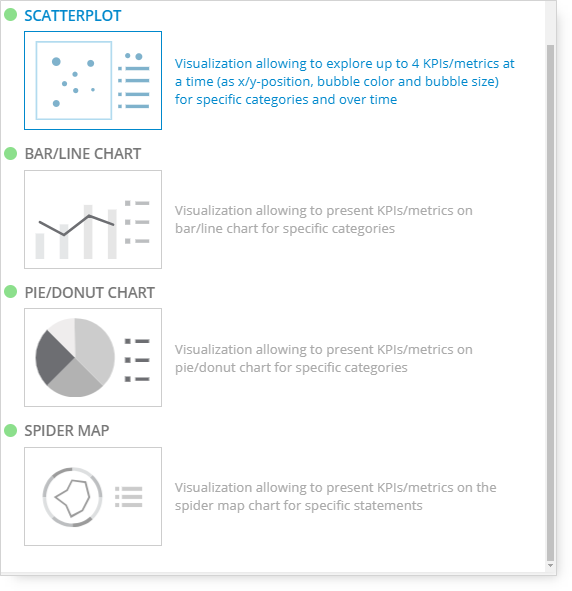
When changing from Crosstab, it is possible to use a Pivot table or visualization options such as Structure Analysis, Frequency Analysis, Scatterplot, Bar/Line chart, Pie/Donut chart, or Spider Map.
The dots next to the crosstabulation, pivot and visualizations indicate the status of the potential conversion:
1. The green dot means that the conversion is possible and all the data from the original chart will be included;
2. The yellow dot beside the options indicates that it is possible to convert the template from Crosstab to another option, but the change will not be lossless (i.e., some information from the Crosstab query will not be included in the new template).
3. A gray dot means the option is not available.
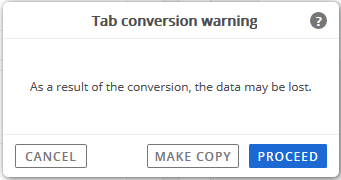
The Tab Conversion Warning message may appear after selecting one of the abovementioned conversion options.
Click 'Proceed' to continue with the conversion, or click 'Make Copy' to keep the existing tab as is, but make a copy of it before continuing with the conversion.
Information that might be excluded includes any formatting types not designated as the Main Statistic, such as Sample Total, Subste Total, and Unweighted Sample Count.
After the conversion completes, a status message will appear on the screen's bottom left corner.
If conversion is successful, the "No errors" message will appear.
If any errors were encountered during conversion, a description of the error(s) will be indicated with a red warning.