Widgets are infographics that can include data references. The widgets will automatically update when there are changes to the data.
In addition to the widgets referencing data points, conditional formatting can be applied.
IMPORTANT: A crosstab is required in Query before working with widgets.
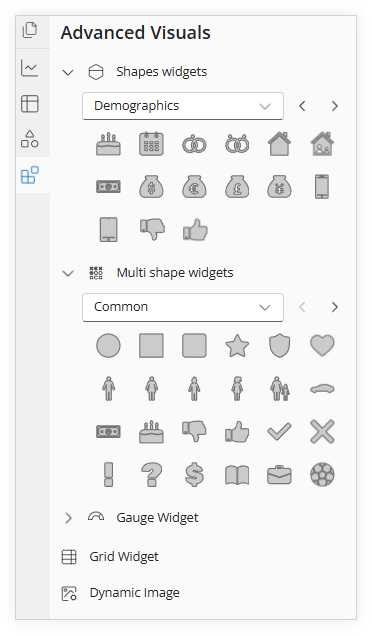
To access the data widget gallery, go to Compose and select the last icon in the left menu.
There are five sections under Advanced Visuals, we will focus on the first two: Shape Widgets which include a gallery of single infographics and Multi Shape Widgets which include a gallery of infographics that will be displayed as multiple shapes when added to the page.
The number of times the widget will be repeated is controlled by a setting in the toolbar.
The following example will use a single shape widget.
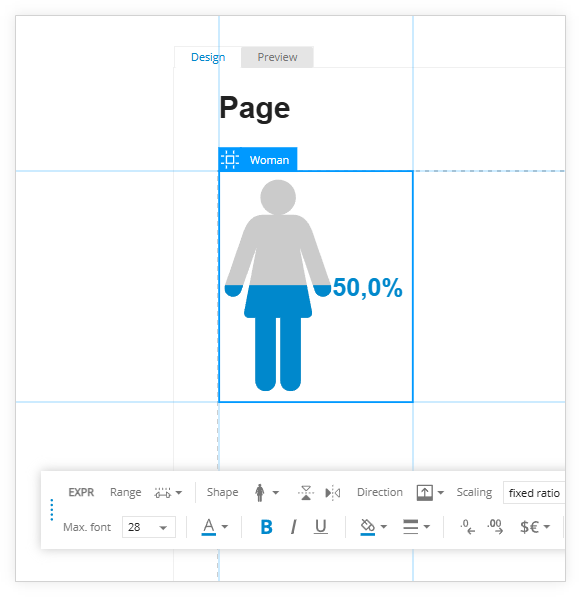
Make a selection from the Shape Widgets gallery and drag it to the page.
The page will default to Design Mode.
To create a data reference for the widget or to manually change the data point that is being displayed, click on the EXPR option (top-left) in the toolbar.
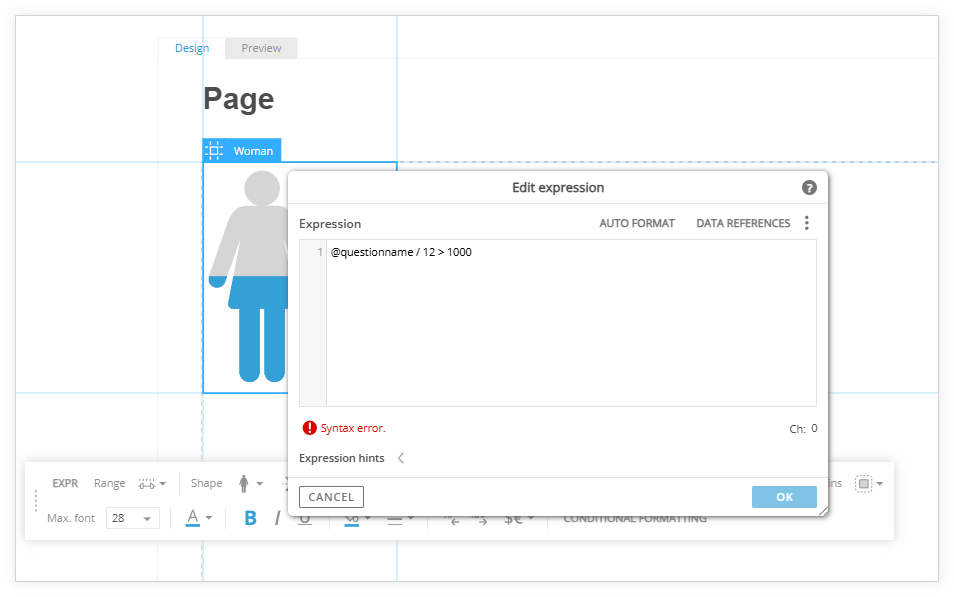
After clicking EXPR, the Expression Editor window will open.
To manually change the data that is being shown in the widget, enter a different value than the default 0.5 value.
By manually entering a value for the widget, a reference back to the data will not be created.
To create a data reference, first delete the contents in the expression editor (e.g., remove 0.5), then click the Data References option in the top-right.
Follow the series of windows and prompts to specify the tab and question to reference. The widget will be updated with the new data reference.
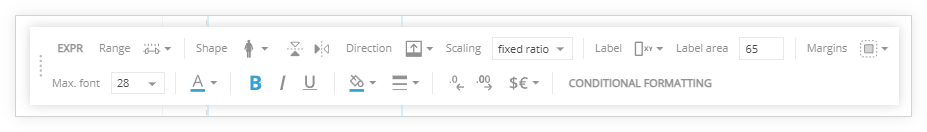
Click on the widget to bring up Edit Mode and display the toolbar for editing options.
Toolbar options:
-
EXPR - this is the expression builder/editor to assign data references to the widget,
-
Range - turns on/off percentages and allows for specifying the min and max range (if applicable),
-
Shape - change the widget to a different shape,
-
Direction - specifies the direction that the widget will show color, the default setting is to start from the bottom,
-
Scaling -
allows you to choose between a fixed scale, maintaining constant size, or a flexible scale, adapting dynamically to available space,
-
Label - specifies the placement of the data label,
-
Label Area - setting for the data label in relation to the widget
-
Margins - settings for the border of the widget and label
The bottom row consists of mostly the standard editing options.
-
Max. font - changes font size,
-
Font color - changes font color,
-
Bold, Italics, and Underline - these options let you emphasize text by making it thicker, slanted, or underlined for better readability and impact,
-
Fill and background color - these options let you customize the appearance by adjusting the inner fill and the surrounding background,
-
Style and Color of the border lines - allows you to customize the appearance of border lines with different designs and colors,
-
Increase/decrease decimals - this o
ption lets you adjust the number of decimal places displayed for precise numerical formatting,
-
Add a Prefix and/or suffix - this option lets you attach text or symbols before or after a value for better context and clarity,
-
Conditional Formatting - this option allows you to automatically change the appearance of cells based on specific rules or values.
Continue to add content to the page by including additional widgets or to use the Conditional Formatting options, proceed with the next steps.
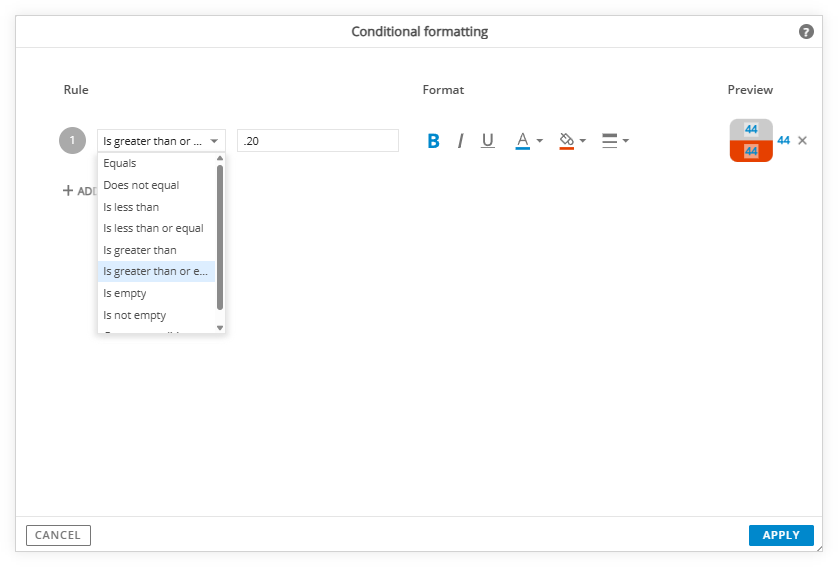
With the widget still selected and in Edit Mode, click the CONDITIONAL FORMATTING option in the toolbar.
The Conditional Formatting window will open.
Click the + sign to define a new condition.
In this example, if the value is “greater than or equal” to 20%, the widget will be displayed in the specified color.
Click the Apply button.
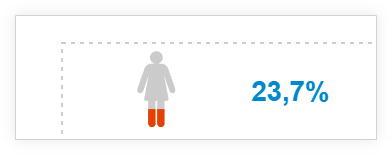
Since the data point for the widget met the conditional criteria, the widget is now being shown in orange, which was specified in the conditional formatting.
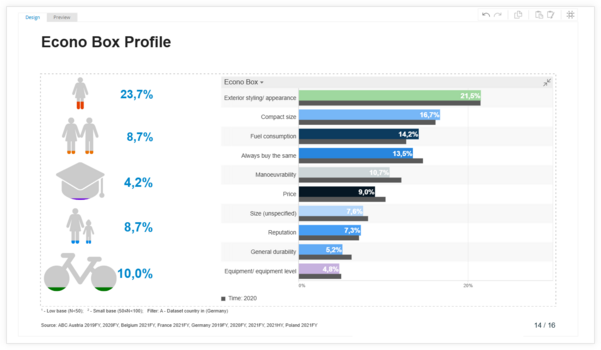
Continue to add additional content to the page.
This example includes a frequency analysis chart and multiple widgets.