Numeric Ranges - Dynamic Images & Expressions
Dynamic images can also be used to display a certain image depending on a range that the data value falls under.
For example, if the data falls within the 0-49% range, show image1.
For 50-79%, show image 2 or for 80-100%, show image 3.
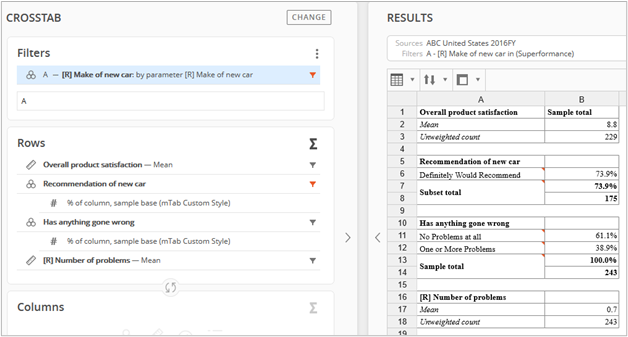
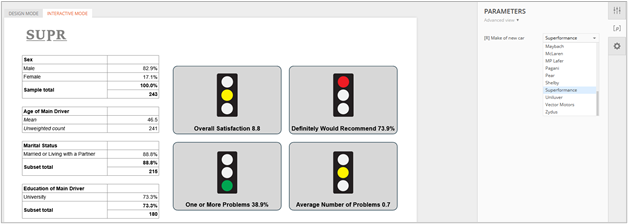
Start with a crosstab. For this example, the “vehicle make” question has been parameterized in the filters.
Including a parameter or parameters is not necessary when using dynamic images.
However, it allows the contents of the page in Compose to be easily changed to another selection.
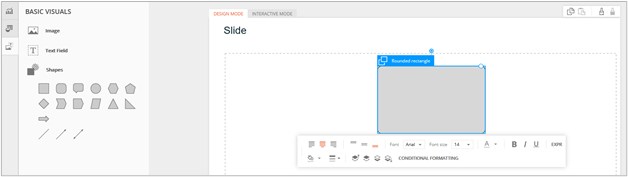
After setting up a crosstab query in Query, go to Compose and drag a shape onto a new page.
A shape is not required when using dynamic images.
However, in this example a shape will accompany the dynamic image to improve the aesthetic of the page and to provide additional context by including a data point and description from the shape’s expression.
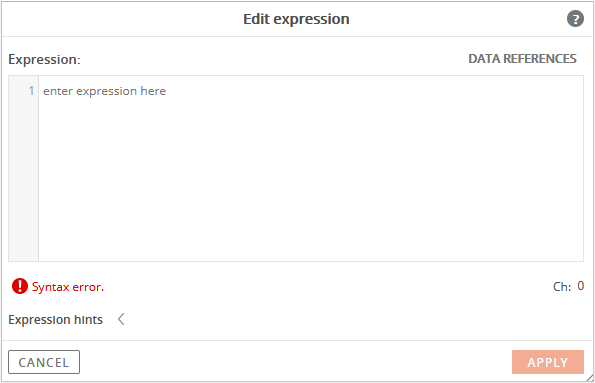
After adding a shape to the page, click the EXPR option in the shape menu bar to open the expression editor.
Click the Data References option in the expression editor.
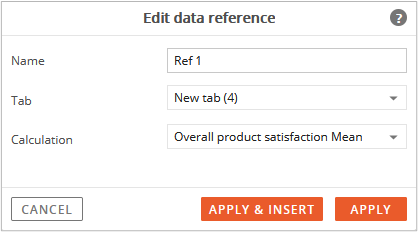
Create a new data reference to the crosstab.
Follow the prompts to make the appropriate selections in the Edit Data Reference window.
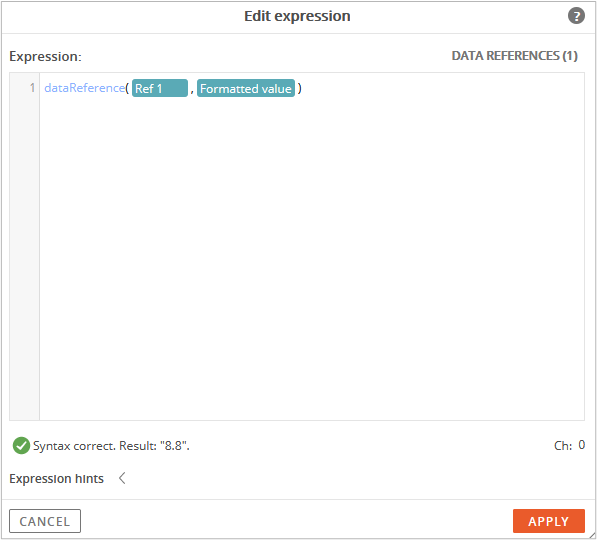
For this example, the expression will reference the “Overall Satisfaction” question.
Since the “overall satisfaction” question in the crosstab was formatted as a mean, the data result from the expression will also appear as a mean.
Confirm that the expression syntax has a green checkmark and the result matches the data in the crosstab. (A mean of “8.8” for this example.)
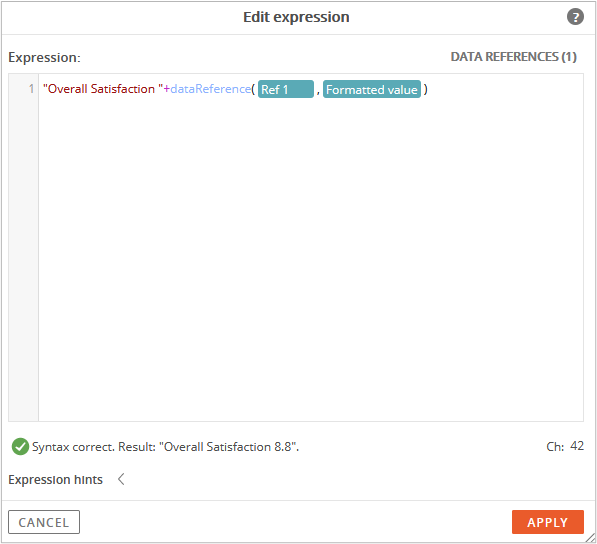
In addition to showing the mean overall satisfaction score in the shape, a text description will be included.
In the expression editor, type “Overall Satifaction ”+ at the beginning of the expression.
The expression syntax should return to a green checkmark after typing the text.
Click the Apply button to complete changes and exit the expression editor.
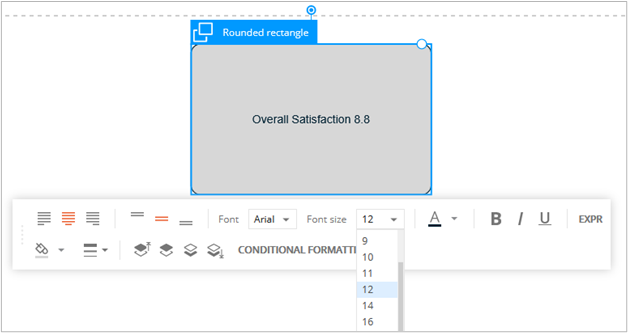
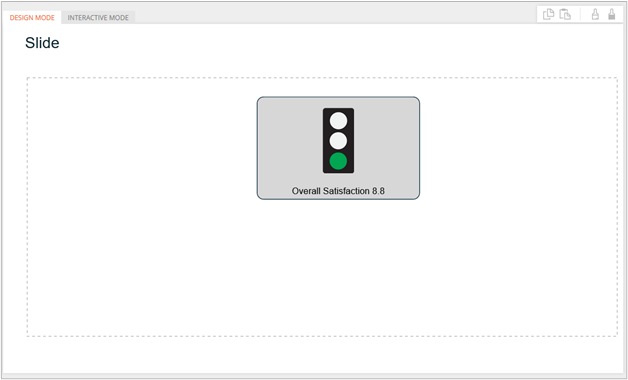
The shape will appear with the results of the expression (Overall Satisfaction 8.8).
Make changes to the text alignment and other desired formatting options such as font size, color, etc.
The alignment of the expression text will be changed so it appears at the bottom of the shape.
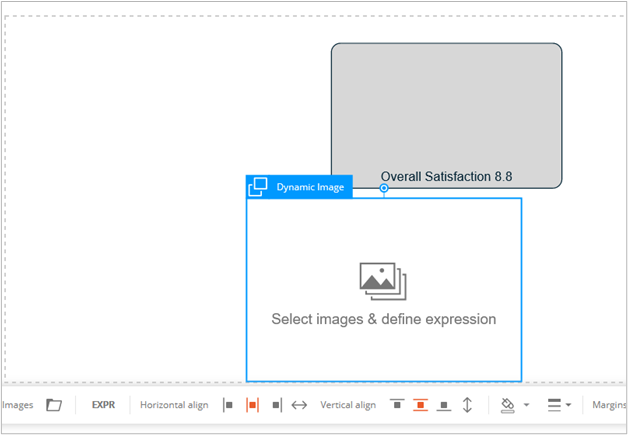
Next, drag a Dynamic Image onto the page from the left menu bar.
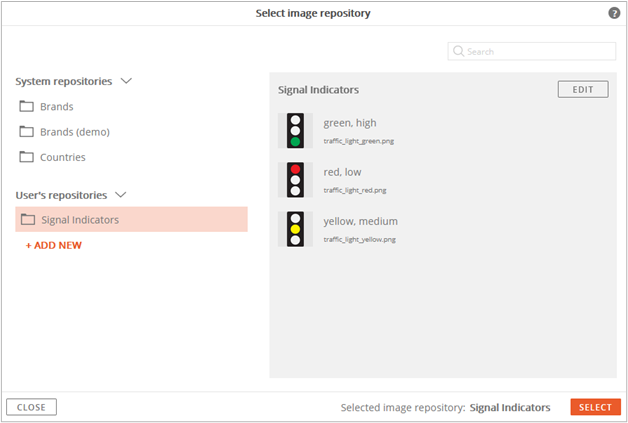
Then, click the Images icon in the bottom menu bar of the dynamic image to select the repository to use.
Choose either a system or a user repository.
For this example, the user repository named “Signal Indicators” is selected.
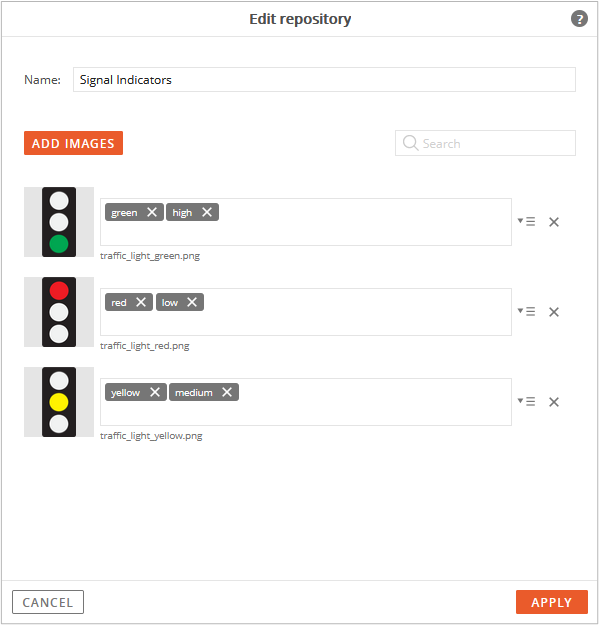
As a reminder, any user repository can be edited if additional images or tags need to be included.
To include additional tags, type more descriptive labels into the text fields of any of the images.
Click the Apply button to confirm the repository selection and return to the page.
The selected image repository with the signal indicators now needs to be linked to the data by defining the expression.
Click the EXPR icon in the bottom menu bar of the dynamic image to open the expression editor.
These next few steps are a repeat of the steps required to create the shape expression.
Click the Data References option in the expression editor.
Create a new data reference to the crosstab.
Follow the prompts to make the appropriate selections in the Edit Data Reference window.
The expression will reference the “Overall Satisfaction” question.
The data result will appear as a mean.
Since the “overall satisfaction” question in the crosstab was formatted as a mean, the data result from the expression will also appear as a mean.
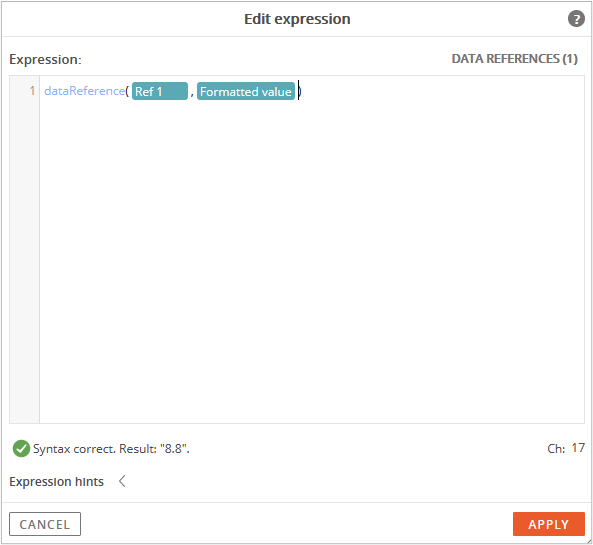
Confirm that the expression syntax has a green checkmark and the result matches the data in the crosstab. (A mean of “8.8” for this example.)
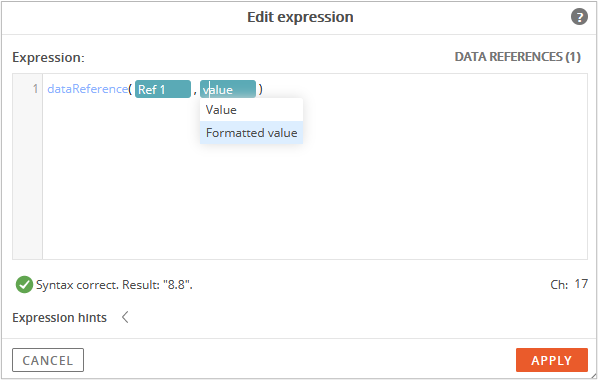
The expression syntax needs some additional editing to use with dynamic images.
Click on Formatted value and change it to Value
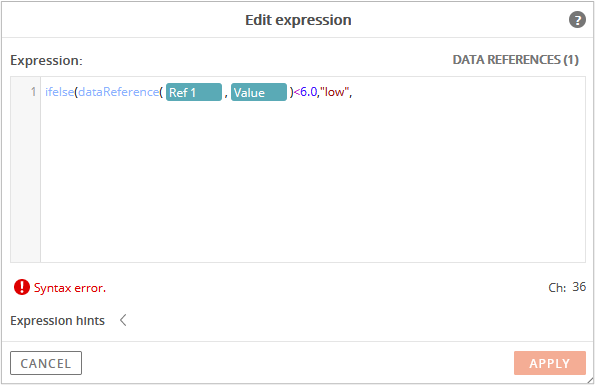
Next, edit the expression by typing ‘ifelse(’ at the beginning of the expression and ‘<6.0,”low”,’ at the end of the expression.
This part of the expression is saying if the value of the data reference is less than “6.0” then use the dynamic image that is tagged as “low.”
This happens to be the “red” indicator image.
Note: the value of “6.0” is being used just as an example.
It can be changed to any value that makes sense according to the specific data being used in the data reference.
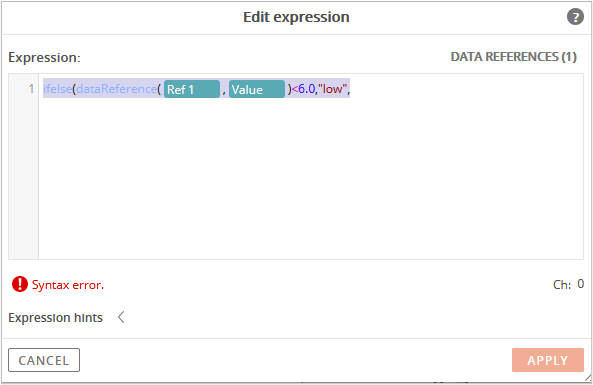
Next, highlight the entire expression and copy it.
Paste the selection at the end of the expression.
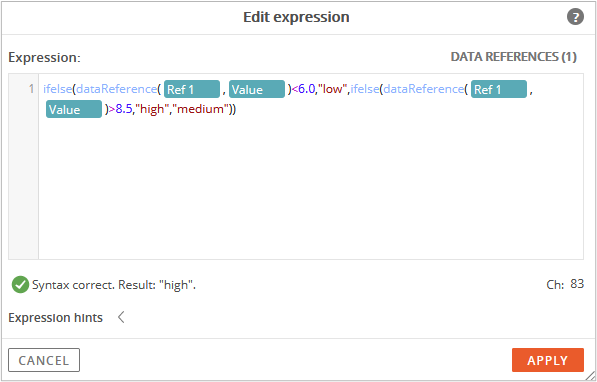
After pasting the expression, edit the pasted content by changing the second instance of <6.0,”low” to ‘>8.5,”high”,”medium”))’
The entire completed expression should now be:
ifelse(dataReference(Ref1,Value)<6.0,"low",ifelse(dataReference(Ref1,Value)>8.5,"high","medium"))
This expression says if the data reference value, which happens to be “8.8” is less than “6.0”, treat this data reference as “low” and show the “red indicator” image.
If the data reference value is greater than “8.5”, treat this data reference as “high” and show the “green indicator” image.
If the data reference value is neither less than 6.0 or greater than 8.5, treat this data reference as “medium” and show the “yellow indicator” image.
After completing the expression, confirm that the expression syntax has a green checkmark again and the result makes sense in reference to the data in the crosstab (i.e. a mean of “8.8” is classified as “high” for this example).
Click the Apply button
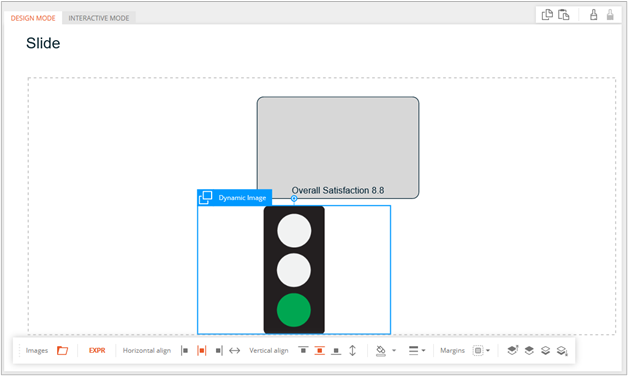
The correct dynamic image from the repository will be displayed based on the expression.
Resize the dynamic image and move it on top of the shape.
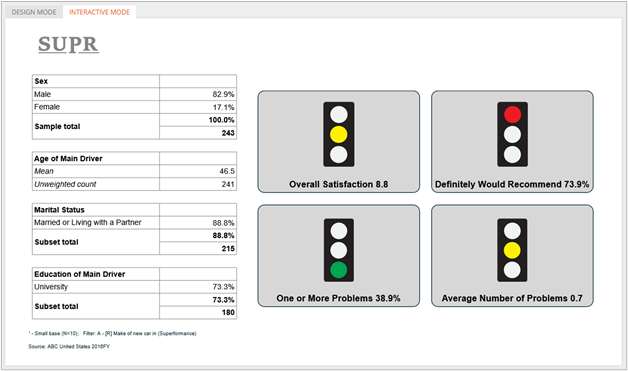
Additional shapes, dynamic images, and a table were added to the page.
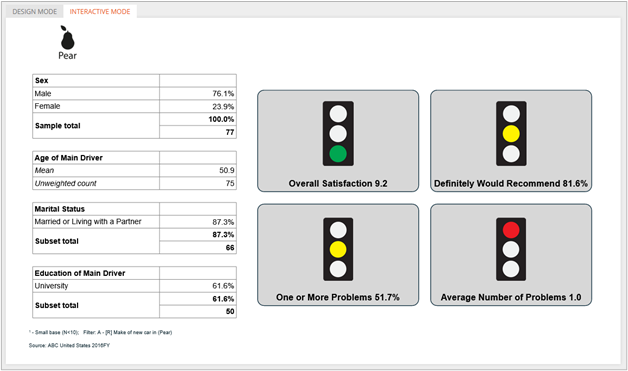
Also, the brand logo was added as a dynamic image, which is also controlled by the page’s parameter.
Selecting a different brand from the parameter settings will change the content of the entire page, since each of the elements on the page references the parameter from the crosstab shown at the beginning of this example.