Once you have your data linked via Add Query to the chart of your preference, then you can manage data via Compose without the need to go back to the Query section. The Display data option, which is located in the right ribbon, is a tool that gives you the ability to directly control all the data in your query which is linked to the chart. This control is essential when dealing with complex crosstabs, as it allows you to dynamically change the data on the two-dimensional chart. With this option, you can make real-time adjustments to the data displayed, providing a bespoke and interactive experience. This means you are free to decide how the information is organized and which elements are emphasized, giving you the capacity to explore various perspectives of the data and draw conclusions.
Let us see an example of the crosstab in Query which contains the following:
1. Rows: Make of new car (categorical question) and Segmentation of new car by brand (categorical question) - both questions are placed at the same level
2. Columns: Engine type of new car (categorical question)
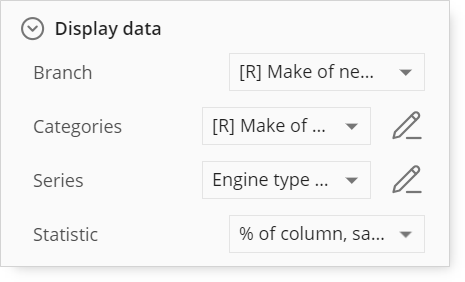
When you link the query from the example to the chart in Compose then the chart will take all the questions one by one so that it can display the data. As there are two questions in the rows panel then we will have “Branch” visible in the Display data section. Each branch can be presented as a separate table in the Query tab and in Compose under the Display data section you can see that branches are the result of multiplication of the questions branches in rows and questions in columns.
If we consider our basic example, then we will have the following branches available:
Make of new car vs Engine type of new car
Segmentation of new car vs Engine type of new car
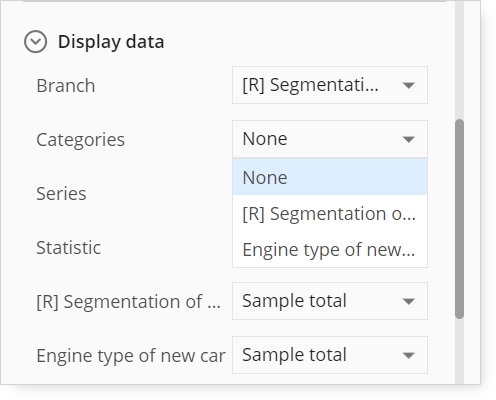
It is possible that any of the three questions can be used in either categories or series sections. If you select Segmentation of new car in branches, then in the categories section you will be able to select only the questions that are related to this branch, in this case, these will be Segmentation of new car and Engine type of new car. Selecting “None” in the series section will move the unused questions to the bottom of the Display data section. This is called Pages section, where the questions that were not used in categories, series and statistics can be used as filters to make your analysis more refined.
Please remember that if you have a numeric question in your crosstab it will be considered to be a statistic and in the Display data section you will be able to select this particular question with the required statistic which was set up earlier in the Query tab.
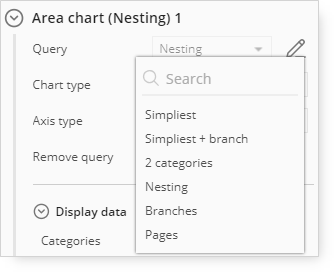
Changing your query
If you want to change the query you selected, to another one, you can do it by Chart settings and clicking the pencil icon. Once you select a new query from the list, it will be immediately linked to your chart which will retain all of the relevant visual settings applied earlier. This may not always be possible, for example if you edit categories which are based on ‘Make of new Car’ and now the categories are based on ‘Segment of new car’ then the chart will not be able to keep most of the tailored visual settings.
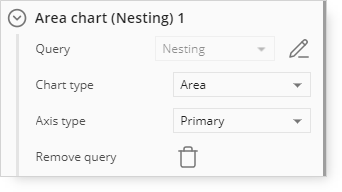
Removing query
The chart component is a predefined template that includes preset conditions controlling the display of data. Consequently, if you remove the data linked to the chart, the chart will remain on your page, but it will no longer display data from this particular query.
In order to remove the data, please go to the Chart settings and select Remove query.
How to edit Categories/Series
As you might want to adjust the Categories and Series displayed on your chart, e.g., remove the Sample total or remove certain entries from the question itself, you can go to the Display data section and select a pencil icon next to the variable that needs to be amended. It will only refine the data that are displayed on the chart and it will not affect the original query.
In our case, we need to remove Sample total from Make of new car therefore we do the following:
-
Go to Display data in the right ribbon;
-
Select pencil icon next to Categories Make of new car;
-
In the modal that appeared on the screen, we are looking for Sample total on the list in the right column;
-
Once Sample total entry is found, we drag and drop it to the left column;
-
Select “Apply” and continue creating your project.
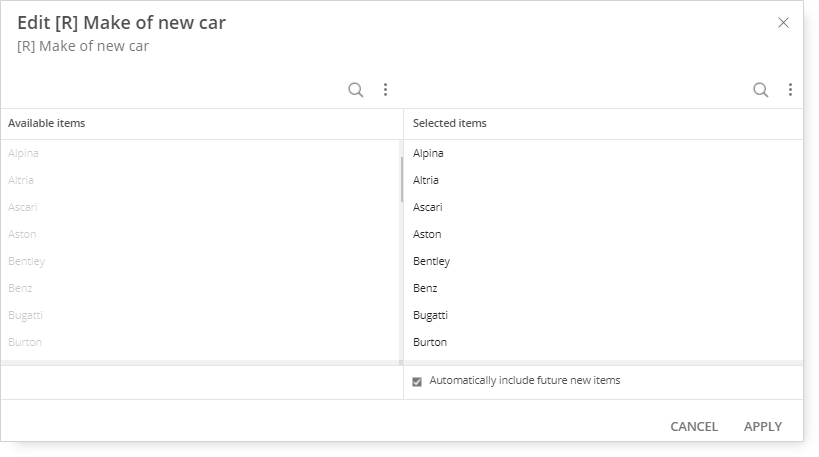
Options available on the modal which is used to edit Categories and Series:
In the modal presented below, you can limit the list of Categories or Series items to the ones that you are interested in. On the left side, there are Available items and on the right side there are Selected items. In the Available Items column, you will find all items that are included in the selected question. In the Selected items column, you will find the items that you chose to include in your analysis.
There is an option “Automatically include future new items”. This option will help you in adding new items to the Selected items list if you decide to change the context of your analysis.
For example:
1. You have a certain country e.g., “Germany”, you selected a question e.g., “Make of new car”, and all items included in a given question are on the Selected items list.
2. In the next step, you can drag and drop one of the selected items to the left column and then these items will not be considered as a part of the analysis.
3. You change the country to another one, e.g., Ukraine and you go to the edit section of “Make of new car”. Once the modal is displayed, the makes which were added to the Available items list are still there, and the new makes only available in the newly selected country are added to the Selected item list if the option is chosen.
If there is a subset on a question that was created in the Query section and which you edit via Display data, you will only see the values from the subset.
You can use search (magnifying glass icon) to look for the required items. There is a possibility to change the order of the list to “alphabetical”, “from query” or “custom” (in case of Selected items). These options are available under three dots next to the search field.
Once you enter the modal, the “from query” option will be selected, if you change the list and e.g., drag Alpina and drop it in the left column, then the “custom” option will be selected automatically.
Option to edit the labels is available in the Selected items list under the burger menu icon which appears once you hover over the name of the item. The “Rename” selection appears and if you click that, the item becomes editable.