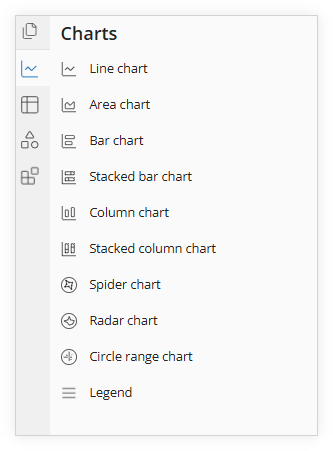
The Charts component in Compose provides an array of chart types to give you the possibility of enhancing your data visualization. You have the flexibility to choose from a variety of chart types, including:
Line chart
Area chart
Bar chart
Stacked bar chart
Column chart
Stacked column chart
Spider chart
Radar chart
Circle range chart
Selecting and Adding a Chart
1. Ensure data preparation: Ensure that you have already created a Crosstab or Pivot in Query section;
2. Go to Compose: Navigate to the Compose section in your application;
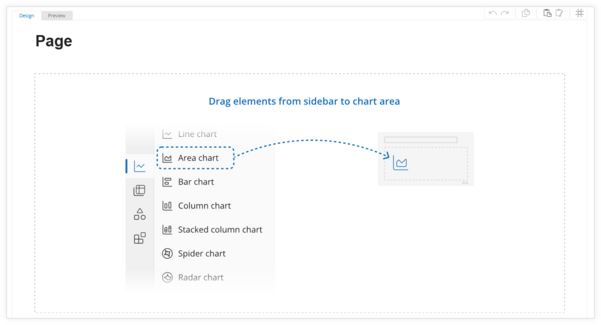
3. Go to the left ribbon: On the left-hand ribbon, you will find a selection of chart types. Choose the chart that suits your needs and drag it onto the page.
4. Add a Query: To provide your chart with data, you will need to add a query that was previously created in the Query section. Please note that only Crosstabs and Pivots can be added to the charts in Compose, and you can include multiple queries in a single chart.
Slide Customization
Within the right ribbon, you will discover several options for customizing your chart pages:
Slide Settings: Under this category, you can tailor the appearance of your charts on the page to match your specific preferences.
Slide parameters: In this section, you can modify parameters (if defined in the used queries) that would affect all pages in your project.
Properties: Within the Properties section, you can change the name of the chart on your page to make it more recognizable and meaningful.
Report settings: In the Report Settings section, you can set the theme (if you have more than one available) that will be included in your project for a consistent and professional look.
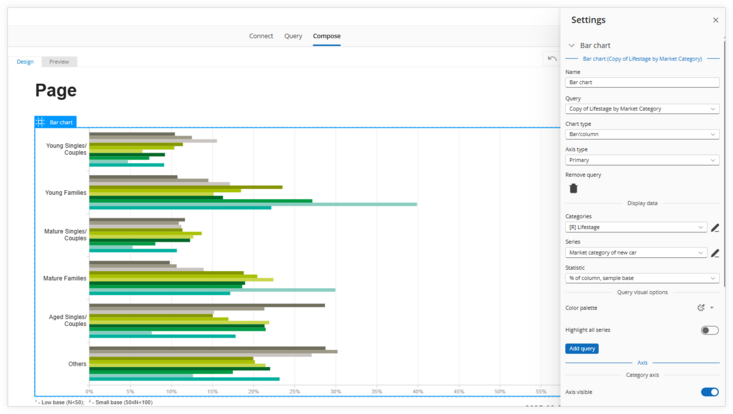
Modify Chart Settings
If you wish to make changes to your selected chart, follow these steps:
2. Make adjustments: Select the relevant options and change, for example, the chart type and modify the axis. You also have the ability to amend the way data is displayed.
3. Further changes: If you want to refine your charts, you can go into the "Axis" and "Visual options" menus to adjust additional settings.
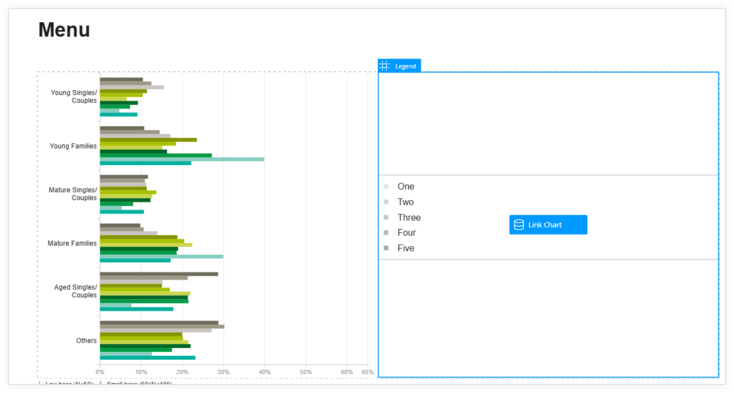
Adding a Legend
If you want to include a legend on your page, drag the legend component from the left ribbon and drop it onto the page. Then, link it to the chart by clicking 'Link Chart' and selecting an available chart from the list.