Significance Testing Across All Columns or Rows
Significance Testing capabilities have been extended to allow comparing each column against all other columns at the same time or each row against all other rows at the same time.
Introduction & Benefits
The main benefit of testing all columns or rows concurrently is that all sig-test results are output in one spreadsheet compared to using either the Significant Differences Reference or Previous settings, which require multiple data runs/exported sheets to capture all sig-test results.
The output created by sig-testing across all columns or rows is very useful for exploratory analysis that is traditionally performed during a first time review of a survey project.
Questions of key interest are typically defined in columns.
Other survey questions are then selected as rows against the column banner.
The columns are then compared for significance against each other.
This report can quickly identify the survey questions that display little or no significant difference between the columns.
Users can then conclude that there may be little to be gained from using those questions with no significant differences in further analysis of the study.
In Analyze, sig-testing across columns or rows is supported.
Query Setup
Start building a query for significance testing.
This example will use significance across columns.
Tip: To sig-test rows instead of columns, flip the questions in rows and columns by clicking the transpose (circular arrows) icon, located between the row and column panels.
Start a query and include a question or questions that are of key interest in the Columns panel.
In the screenshot below, Market Category is included in Columns.
Brand or Model questions can also be included.
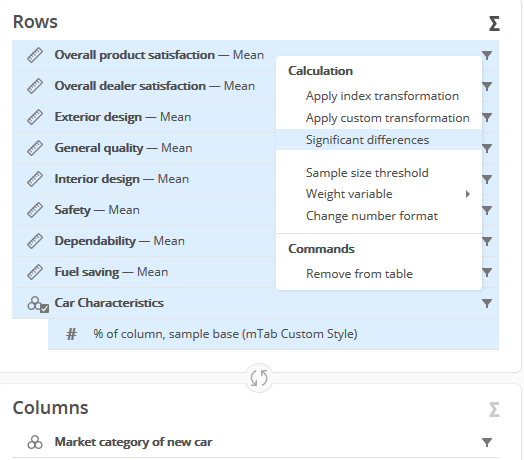
Several satisfaction-related questions and Car Characteristics have been included in Rows.
Note: Questions with different output styles can be included in significance testing.
In the screenshot below, the satisfaction questions are numeric and Car Characteristics is a category question.
The results for satisfaction will be displayed as means and car characteristics will be displayed as percentages.
In the Rows panel, select all questions to include in sig-testing, then choose the Significant Differences option.
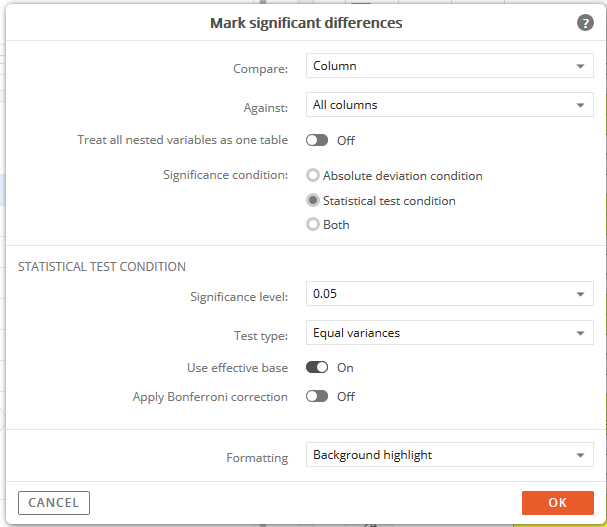
The Mark Significant Differences window will appear.
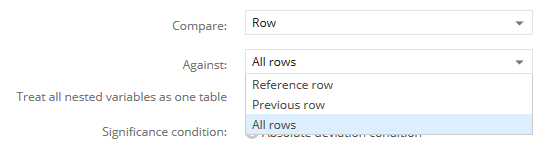
Expand the Against menu and select the All Columns option.
When using the ‘All Columns/Rows’ option, most of the settings are the same as the
Significant Differences for
Reference or
Previous Column/Rows.
The two settings that are exclusive to ‘All Columns/Rows’ are:
-
Apply Bonferroni Correction
-
Bonferroni Correction
The Bonferroni correction is applied to confidence intervals.
Statistical hypothesis testing is based on rejecting the null hypothesis if the likelihood of the observed data under the null hypothesis is low.
If multiple hypotheses are tested, the chance of observing a rare event increases, and the likelihood of incorrectly rejecting a null hypothesis increases.
Bonferroni correction compensates for the potential increase by testing each individual hypothesis at a significance level of α / m, where α is the desired overall alpha level and m is the number of hypotheses.
For example, if a trial is testing m = 20 with a desired α = 0.05, then the Bonferroni correction would test each individual hypothesis at α = 0.05 / 20 = 0.0025.
The Bonferroni Correction is set to off by default.
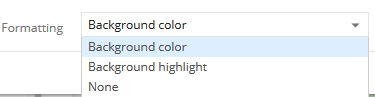
Formatting
The are 3 options for formatting the results for sig-testing across columns/rows:
-
Background Color (default)
-
-
Formatting: None & Results Explained
The None option does not apply any formatting to the spreadsheet output for any column values and indicators that are statistically significant.
Results Explained
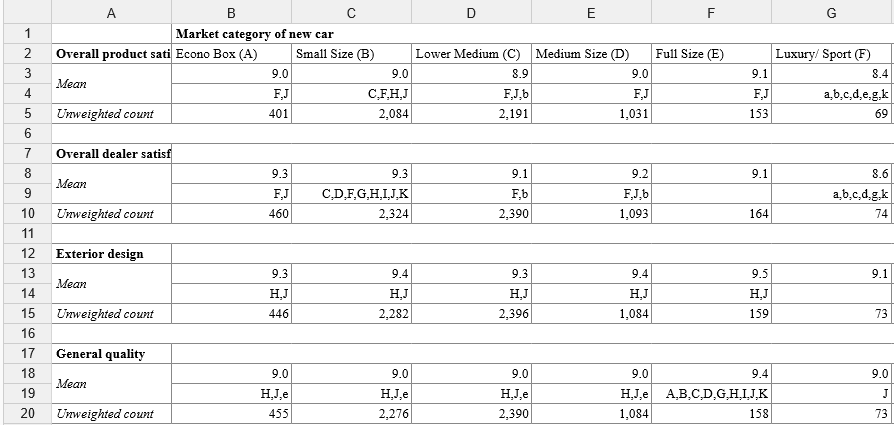
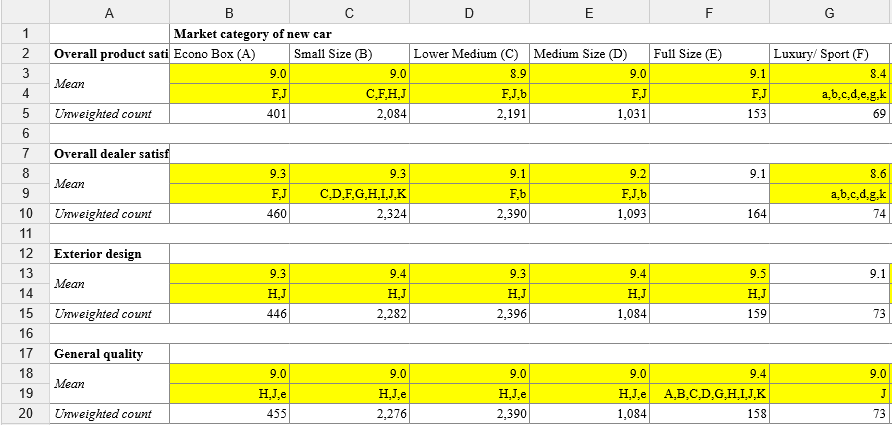
Notice the suffix letters in parentheses that have been added to the question response text labels in row 2.
(e.g. Econo Box (A), Small Size (B), Lower Medium (C), etc.)
These letters are the references used for the significance indicators in rows 4, 9, 14, 19, etc.
The significance indicator letters identify the other columns that the response label's column is statistically different from.
Referring to row 9 of the Lower Medium (C) column in the example above, Lower Medium (C) shows indicators for F,b.
This means that 'Overall Dealer Satisfaction' score for 'Lower Medium (C)' was statistically different compared to 'Luxury Sport (F)' and 'Small Size (B)' .
Significance indicators in UPPER-case mean that the statistically significant differences are higher than the column referenced with the letter.
Significance indicators in lower-case mean that the statistically significant differences are lower than the column referenced with the letter.
The Overall Dealer Satisfaction score for Lower Medium (C) is 9.1
The Overall Dealer Satisfaction score for Luxury Sport (F) is 8.6
The Overall Dealer Satisfaction score for Small Size (B) is 9.3
Since the rating for Lower Medium (9.1) is higher than Luxury Sport (8.6), the indicator for Luxury Sport appears as an upper-case F.
Since the rating for Lower Medium (9.1) is lower than Small Size (9.3), the indicator for Small Size appears as a lower-case b.
Formatting: Background Highlight
The Background Highlight option applies a yellow background cell color to any values and indicators that are statistically significant.
Yellow is used for all indicators and values, regardless if the differences are higher or lower.
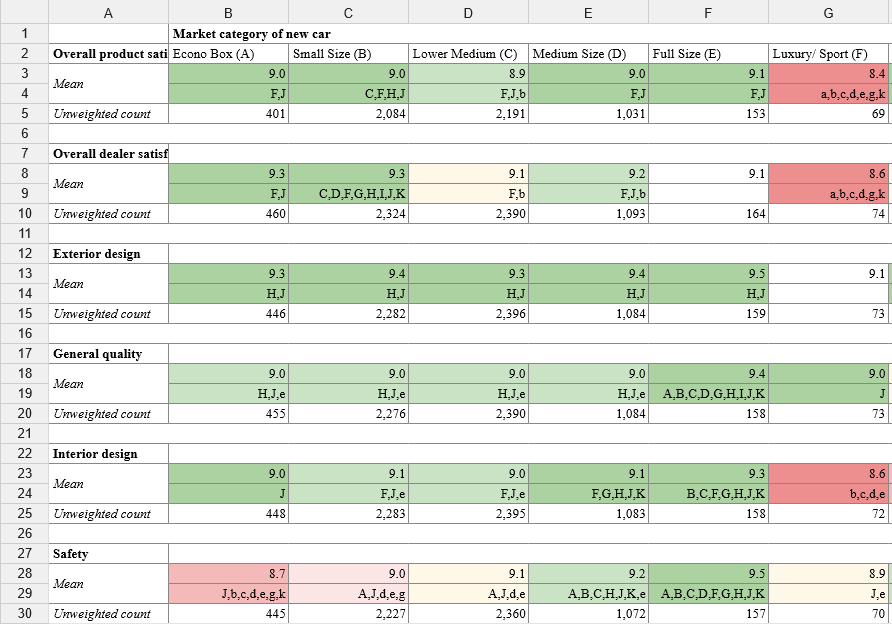
Formatting: Background Color
The default format setting is Background Color.
Instead of applying yellow to all statistically significant values and indicators, the Background Color format uses different colors to identify the degree of significance in comparison to the other columns/rows.
There are 7 colors used for significance indicators:
All cells with either green, yellow, or red applied are statistically different/significant.
|
Color
|
Definition
|
Example
|
Summary
|
|
Green
|
The cell is significantly higher than all other statistically significant cells that it is being compared to, and not lower than any of the significant cells.
|
|
All indicator letters are all upper-case, meaning the cell is significantly higher than all others it is compared to.
(all upper-case, no lower-case.)
C,D,F,G,H,I,J,K = higher
|
|
Medium Green
|
The cell has at least twice as many significantly higher indicators than lower indicators.
|
|
The number of significantly higher indicators is 2x or more than the number of lower indicators.
A,B,C,H,J,K = higher
e = lower
|
|
Light Green
|
Does not fulfill the requirements of ‘Green’ or ‘Medium Green’ AND the cell has more significantly higher indicators than lower indicators.
|
|
The number of significantly higher indicators is still more than the number of lower indicators.
(more upper-case than lower-case).
D,G,H,J = higher
a,b,c = lower
|
|
Yellow
|
The cell has an equal number of statistically significant cells that it is higher and lower to.
|
|
The number of indicator letters that are upper and lower-case is the same.
A,J = higher
d,e = lower
|
|
Light Red
|
Does not fulfill the requirements of ‘Red’ or ‘Medium Red’ AND the cell has more significantly lower indicators than higher indicators.
|
|
The number of significantly lower indicators is still more than the number of higher indicators.
(more lower-case than upper-case).
d,e,f,g = lower
A,B,J = higher
|
|
Medium Red
|
The cell has at least twice as many significantly lower indicators than higher indicators.
|
|
The number of significantly lower indicators is 2x or more than the number of higher indicators.
c,d,e,g,k = lower
J = higher
|
|
Red
|
The cell is significantly lower than all other statistically significant cells that it is being compared to, and not higher than any of the significant cells.
|
|
All indicator letters are lower-case, meaning the cell is significantly lower than all others it is compared to.
(all lower-case, no upper-case.)
a,b,c,d,e,k = lower
|