Compose allows users to include customized shapes in slides.
Use the Shapes feature to complement the visualizations in Compose.
After creating a visualization in Analyze, go to Compose to create a slide and add one or more visualizations to the slide.
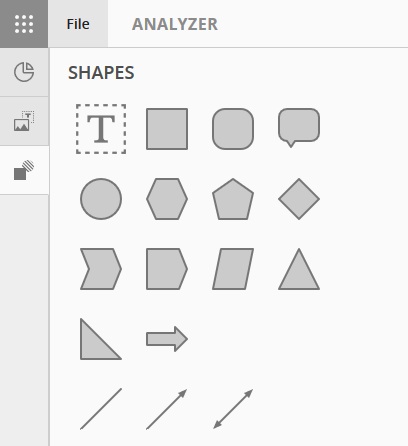
Shapes are available in the upper-left, under the Objects menu.
In addition to the available shapes gallery, line options and an overlaying text field are also available.
Select a shape, line, or text box and drag it onto the slide.
Note: The text field option included in the Shapes menu is different than the text option in the Objects menu. The text field in Shapes can be overlayed on top of other things anywhere on the slide; including the title, body, or footer. The text field in Objects is used only in the body of the slide and occupies its own region. It cannot be placed on top of another object.
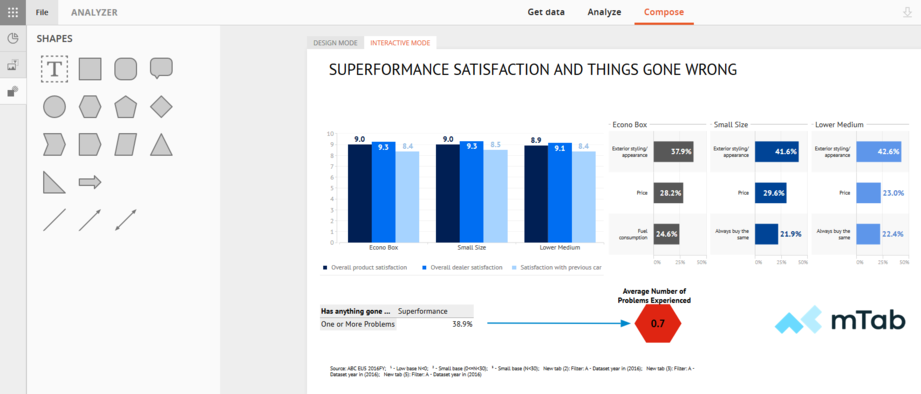
This example illustrates the following included in the slide:
Blue arrow
Red hexagon
Text box “Average Number of Problems Experienced”
Data Expression ‘0.7’ (more details on this below)
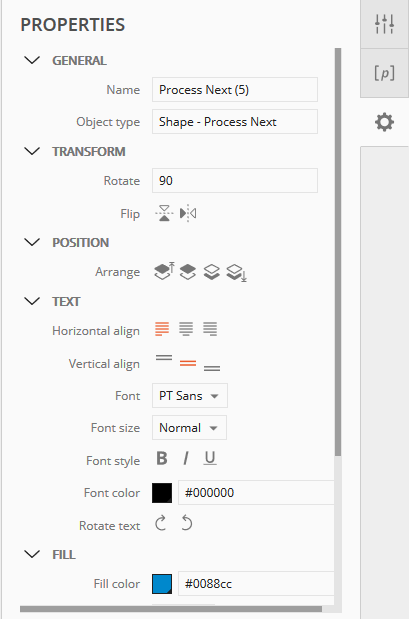
In addition to including shapes, users can also use Expressions to create dynamically linked references to data points or text, so when changes to the dataset occur, the linked references will automatically update.
In the red hexagon example above, the average number of problems, ‘0.7’ is linked to the data and will change when the dataset is updated.