Regenerating Analyze Slides In Stories
Users can create visualizations in Analyze that use Parameters. These visualizations can then be exported to Stories and shared with other users.
(For more information on Parameters, refer to the Analyze 2.8 Release Notes, the Analyze manual, or the Parameter feature video).
Since the Stories were generated using Parameters from Analyze, the recipients of the shared Stories can change the content of the slides within the Stories by selecting different options in the Parameters.
If the creator of a Story built the visualizations using Parameters for options such as Country or Year, then the users who are viewing the shared Story can make changes to the slide content by selecting a different option under the Country Parameter (e.g. change EU5 to United Kingdom).
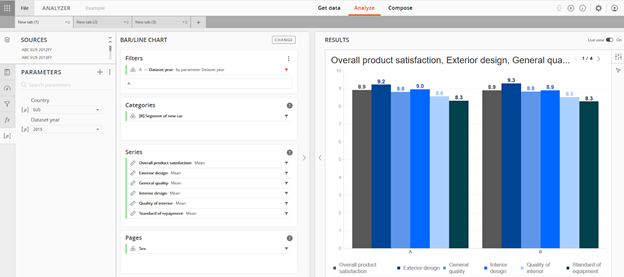
A user starts in Analyze and creates a query that uses one or more Parameters.
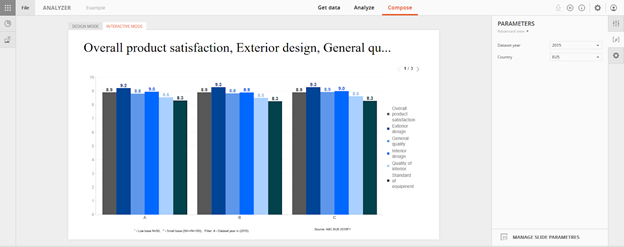
The user builds at least one table or chart visualization in Compose.
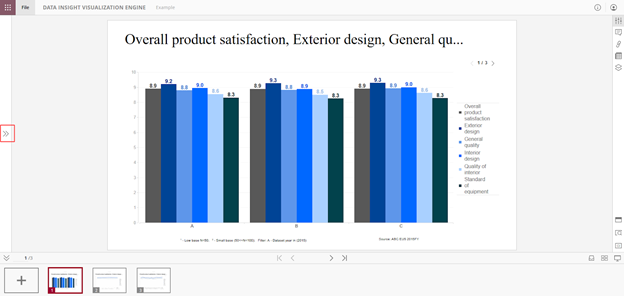
Next, the user exports the visualization to My Stories and either shares or publishes that Story to additional users.
After opening the shared or published Story, the recipients can click the double arrow on the left side of the panel to expand the options.
This example chart is displaying results from the 2015 EU5 dataset.
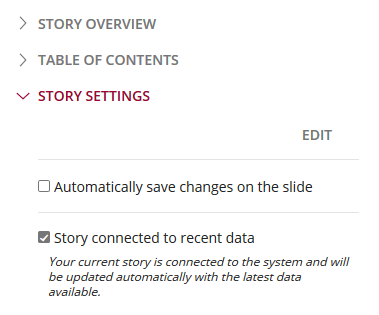
Expand the Story Settings menu and click Edit.
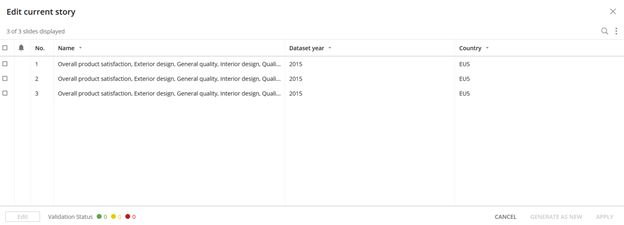
The Edit Story options will be displayed.
In this example, the available options show that the visualizations in the slides were built using Parameters named, Dataset Year and Country. Both are listed as selectors.
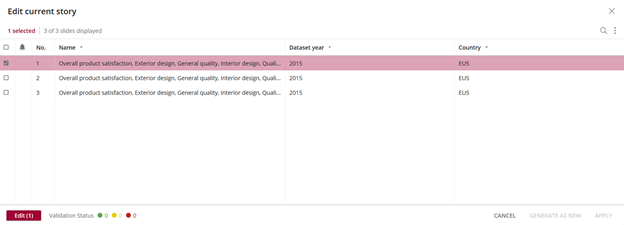
To change the selector(s) of a slide, click on the description listing and then click the Edit button.
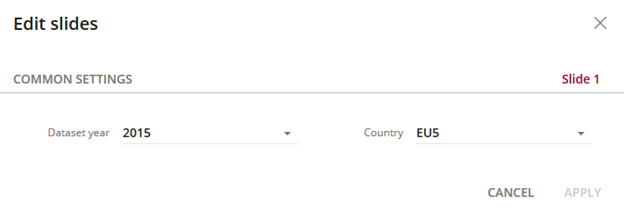
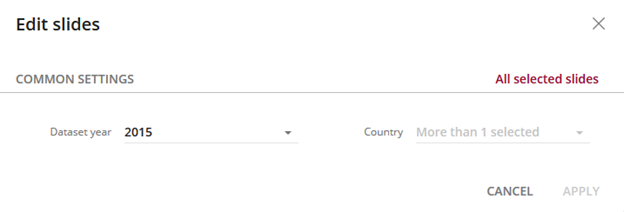
The Common Settings options will be available as selectors.
Make changes to one or more of the selectors, then click Apply.
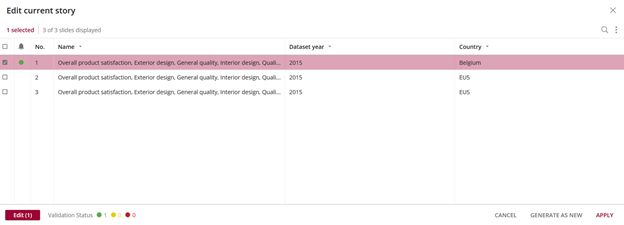
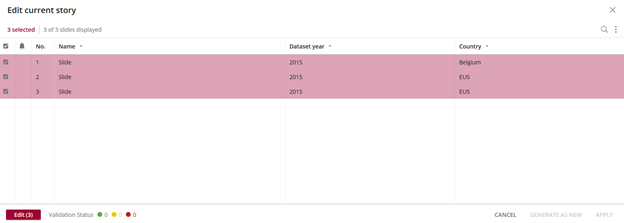
The user will return to the Edit Current Story window.
The changes to any selectors will be reflected in this window.
(Country for slide 1 was changed from EU5 to Belgium.)
Click Apply to make the changes to the slide content.
The slide(s) will reload and the visualization(s) will be updated to reflect the changes to the data.
(Slide 1 will now show Belgium data instead of EU5.)
Productivity Tip:
It is possible to select more than one slide at a time to update changes.
However, if the options being displayed are not all consistent between the selected slides (in this example, Country = Belgium and EU5), then all of the selector options will need to be made consistent first.
Any selectors with “More than 1 selected” will need to be changed individually first.
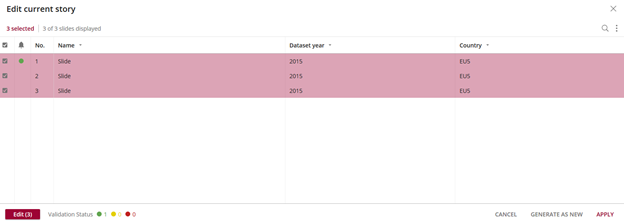
Change slide 1 country from Belgium to EU5, which will make the Country selectors consistent.
Now all slides can be selected and changed at the same time.