Query Types For Visualizations
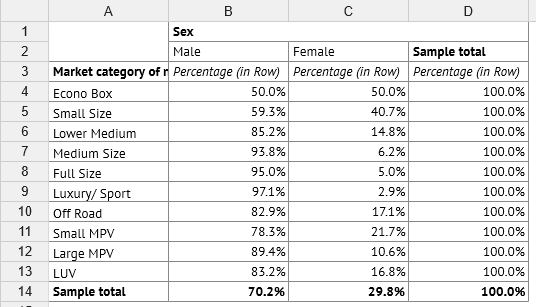
Pivot
A tabular output template with panels that include rows and columns.
Questions can be nested in rows and columns.
Unlike crosstabs, a single, specific statistic/calculation/count is defined and used for each Pivot question.
Can be converted into a visualization template easier than a crosstab template to a visualization template.
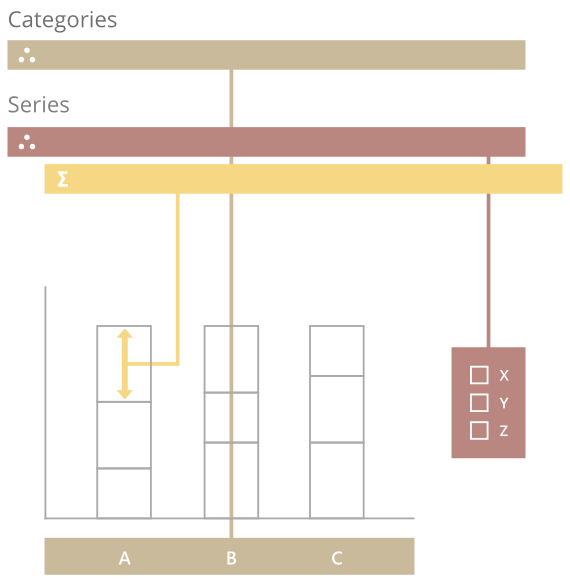
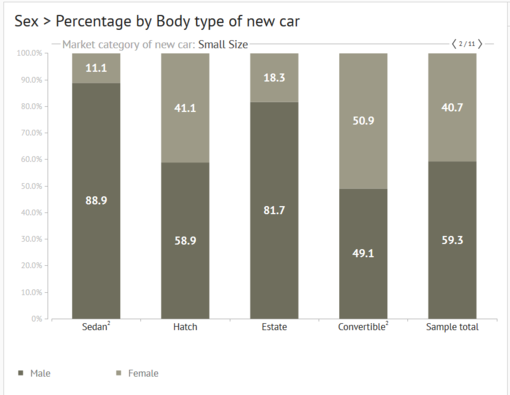
Structure Analysis
A visualization template
Does not include panels for rows and column output. Instead, panels include Categories and Series.
Questions used in Categories and Series can be nested.
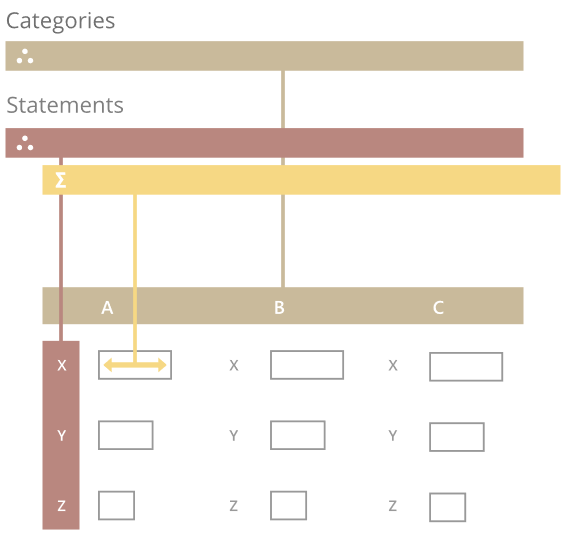
Frequency Analysis
A visualization template
Does not include panels for rows and column output. Instead, panels include Categories and Statements.
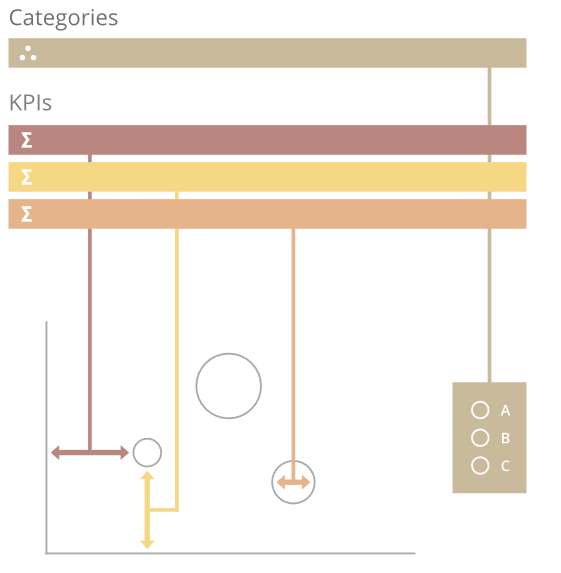
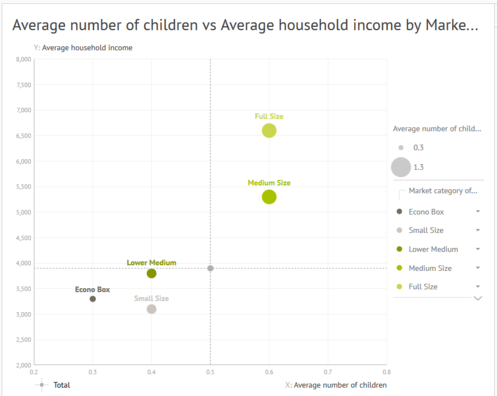
Scatterplot
A visualization template
Does not include panels for rows and column output. Instead, panels include Categories and KPIs.
Allows up to 4 KPIs/metrics at a time (as x/y-position, bubble color and bubble size) for specific categories and over time.
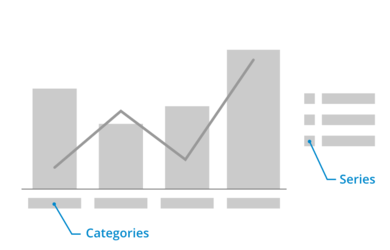
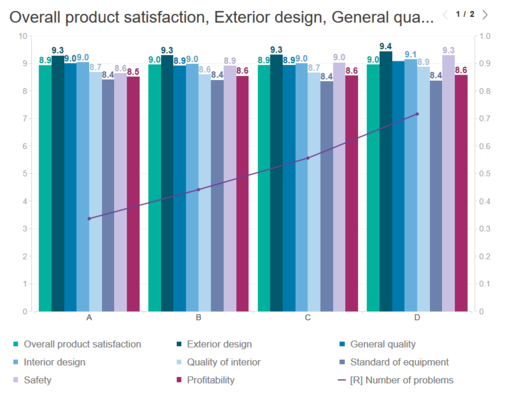
Bar-Line Chart
A visualization template
Does not include panels for rows and column output. Instead, panels include Categories and Series.
Use to create charts depicting data in bars or lines, or in a combination of bars and lines on the same chart.
Charts can be oriented either horizontally or vertically.