Widgets are infographics that can include data references. The widgets will automatically update when there are changes to the data.
In addition to the widgets referencing data points, conditional formatting can be applied.
IMPORTANT: A crosstab is required in Analyze before working with widgets.
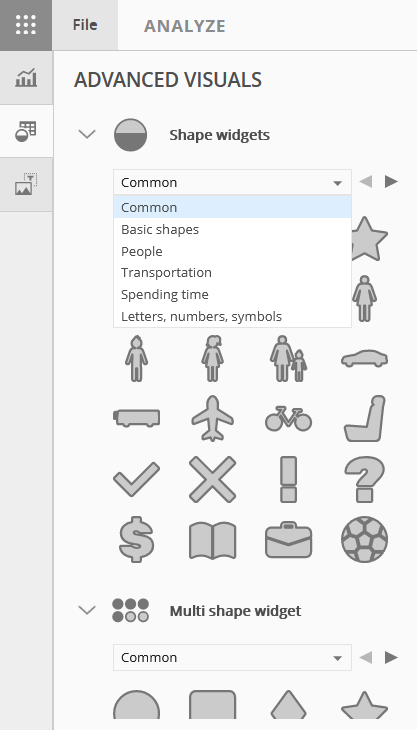
To access the data widget gallery, go to Compose and select the middle icon in the left menu.
There will be two sections, Shape Widgets which include a gallery of single infographics and Multi Shape Widgets which include a gallery of infographics that will display as multiples when added to the slide.
The number of times the widget will repeat is controlled by a setting in the toolbar.
The following example will use a single shape widget.
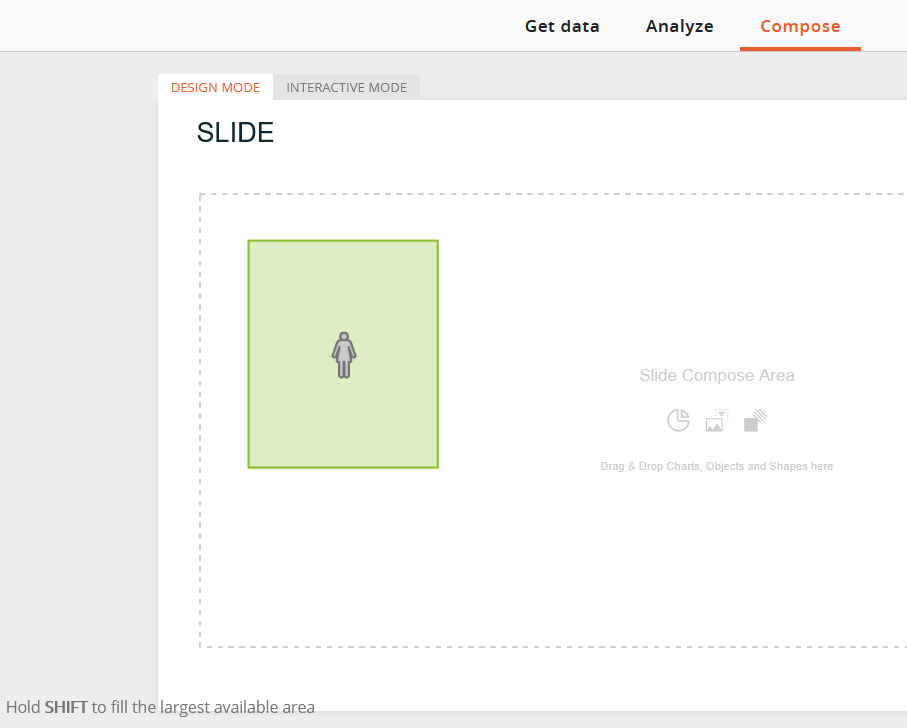
Make a selection from the Shape Widgets gallery and drag it to the slide.
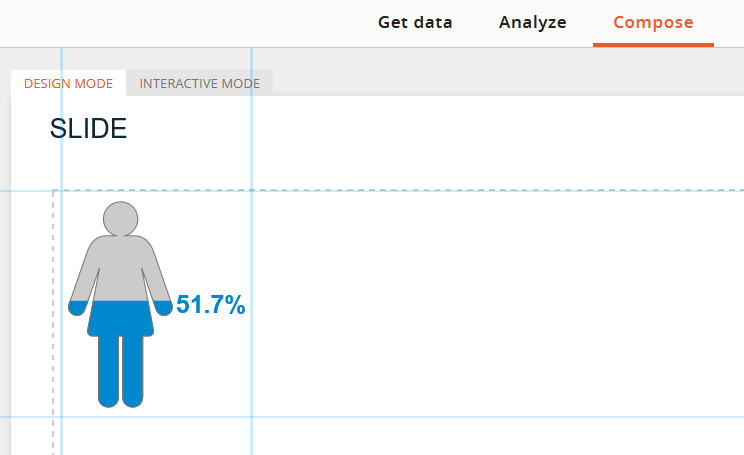
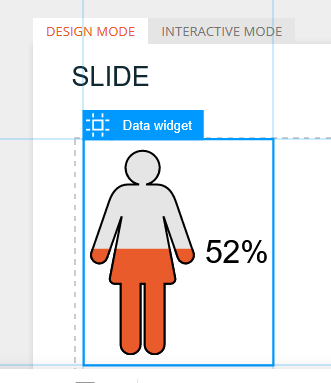
The slide will default to Design Mode.
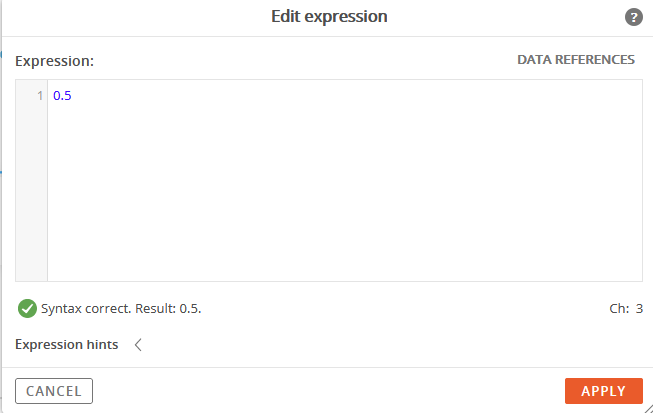
To create a data reference for the widget or to manually change the data point that is being displayed, click on the VALUE option (top-left) in the toolbar.
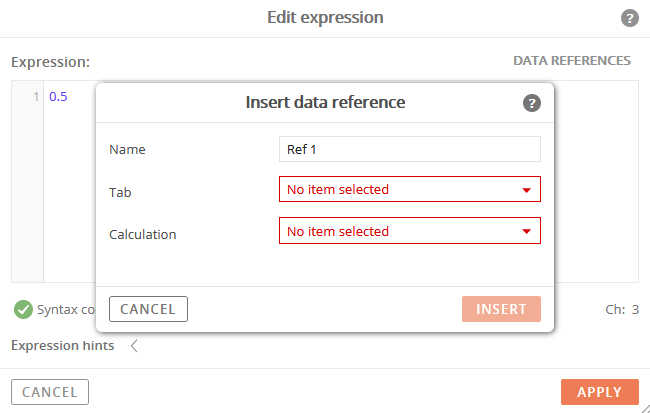
After clicking on VALUE, the Expression Editor window will open.
To manually change the data that is being shown in the widget, enter a different value than the default 0.5 value.
By manually entering a value for the widget, a reference back to the data will not be created.
To create a data reference, first delete the contents in the expression editor (e.g. remove 0.5), then click the Data References option in the top-right.
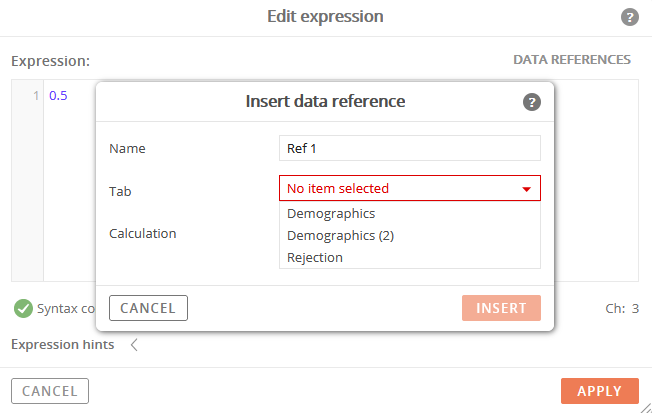
Follow the series of windows and prompts to specify the tab and question to reference.
In the example above, 3 Crosstabs were run in Analyze, which appear as selectable options in the Tab menu.
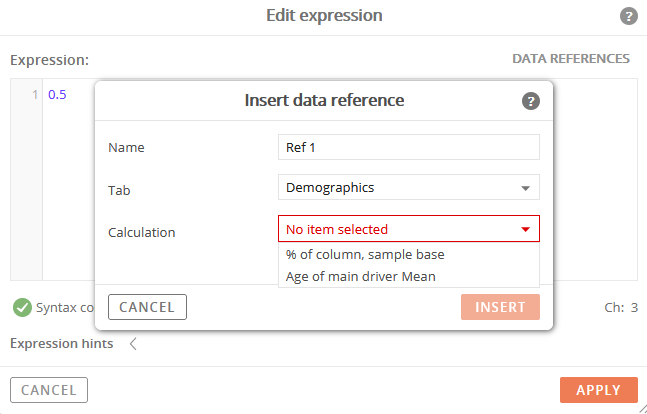
Next, select the question/calculation.
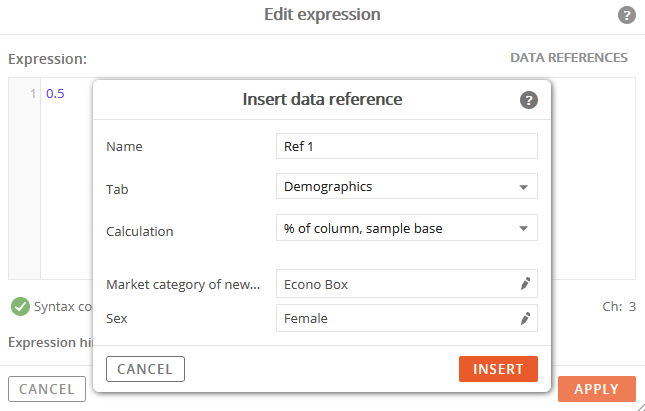
The next set of prompts will ask for the category question references (e.g. Market Category of Car = Econo Box and Sex = Female).
After specifying the references, click the Insert button.
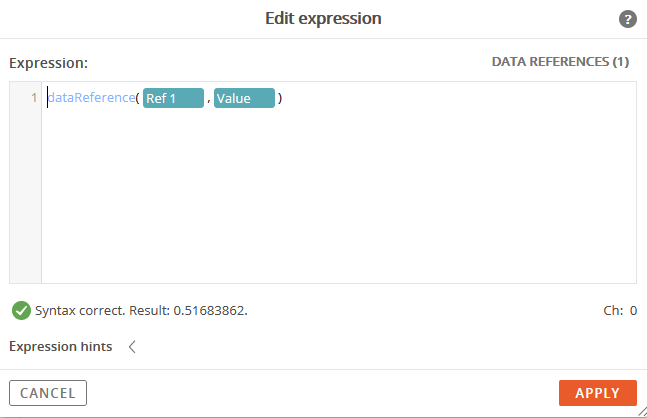
The Expression Editor will display the expression syntax.
If there are no issues with the previous references, a green checkmark icon with a message of “Syntax correct” will be shown, along with the value that will accompany the widget.
In the example, 51.7% will be displayed.
Click the Apply button.
The widget will be updated with the new data reference.
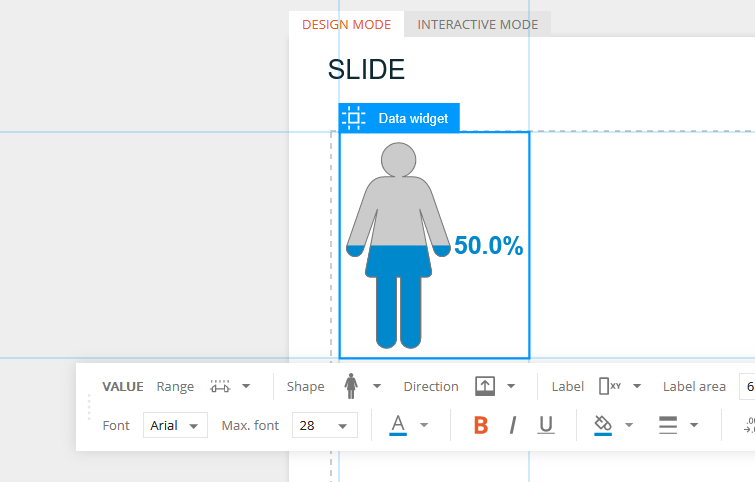
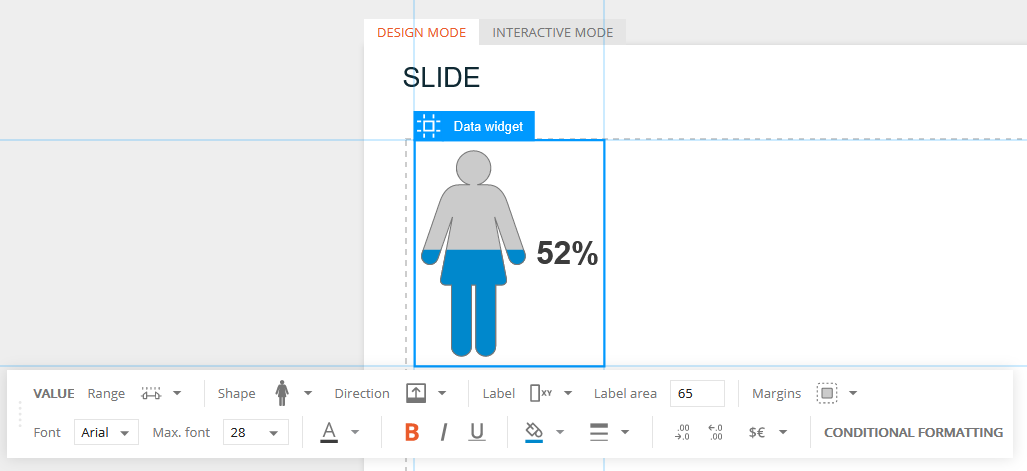
Click on the widget to bring up Edit Mode and display the toolbar for editing options.
Toolbar options:
-
VALUE - this is the expression builder/editor to assign data references to the widget
-
Range - turns on/off percentages and allows for specifying the min and max range (if applicable)
-
Shape - change the widget to a different shape
-
Direction - specifies the direction that the widget will show color, the default setting is to start from the bottom
-
Label - specifies the placement of the data label
-
Label Area - setting for the data label in relation to the widget
-
Margins - settings for the border of the widget and label
The bottom row consists of mostly the standard editing options.
The following are some that are specific to Widgets.
-
Increase/decrease decimals
-
Add a Prefix and/or suffix
-
At this point, the widget has been updated with a data reference.
Continue to add content to the slide by including additional widgets or to use the Conditional Formatting options, proceed with the next steps.
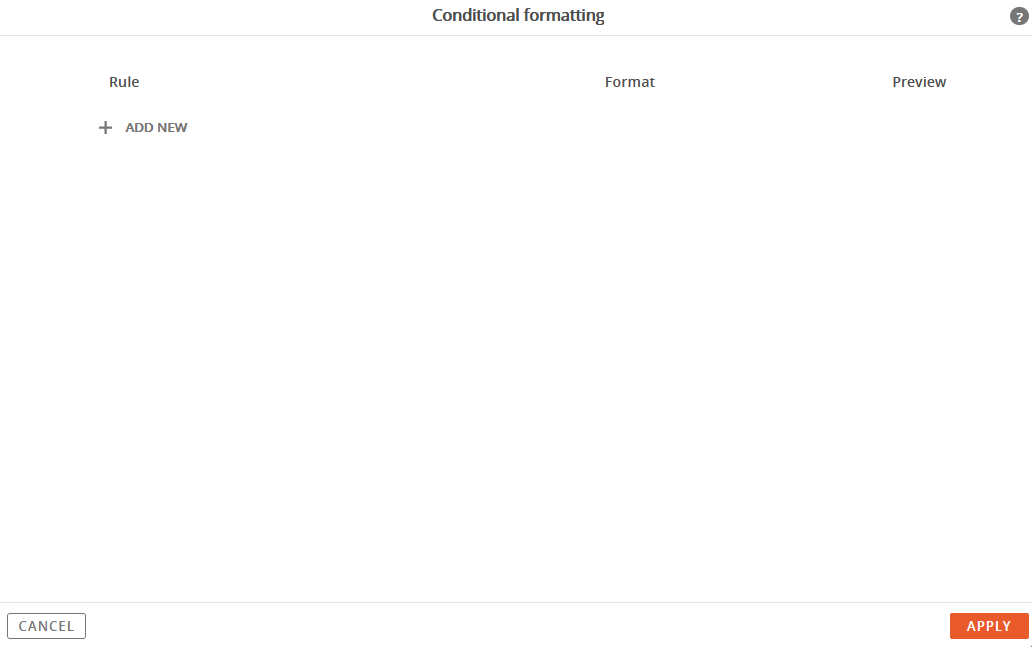
With the widget still selected and in Edit Mode, click the CONDITIONAL FORMATTING option in the toolbar.
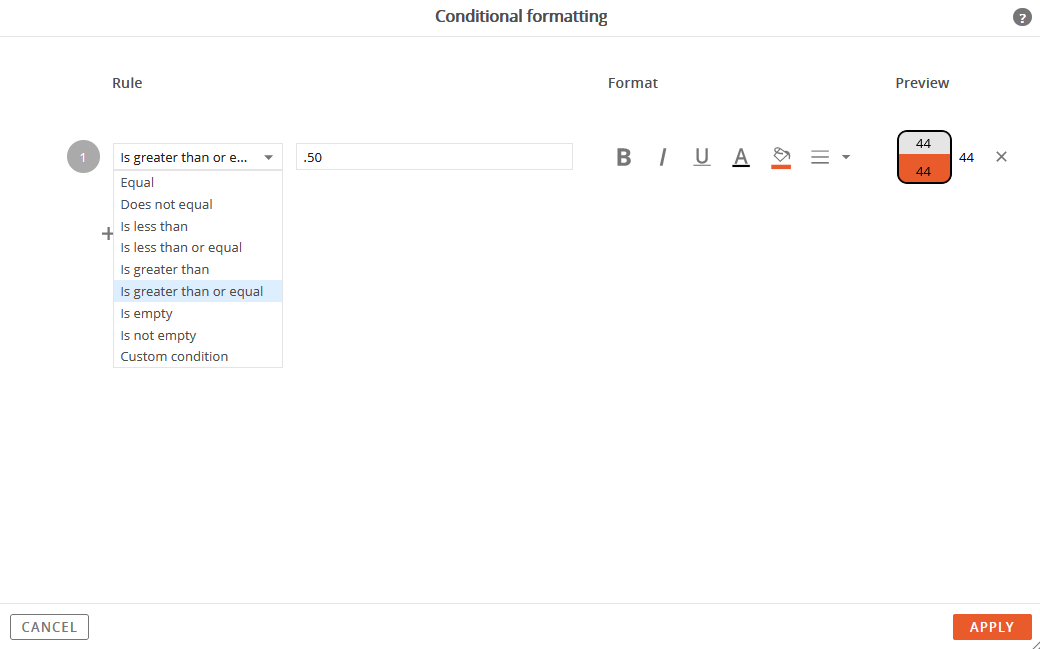
The Conditional Formatting window will open.
Click the + sign to define a new condition.
In this example, if the value is “greater than or equal” to 50%, the widget will be displayed in the specified color.
Click the Apply button.
Since the data point for the widget met the conditional criteria, the widget is now being shown in orange, which was specified in the conditional formatting.
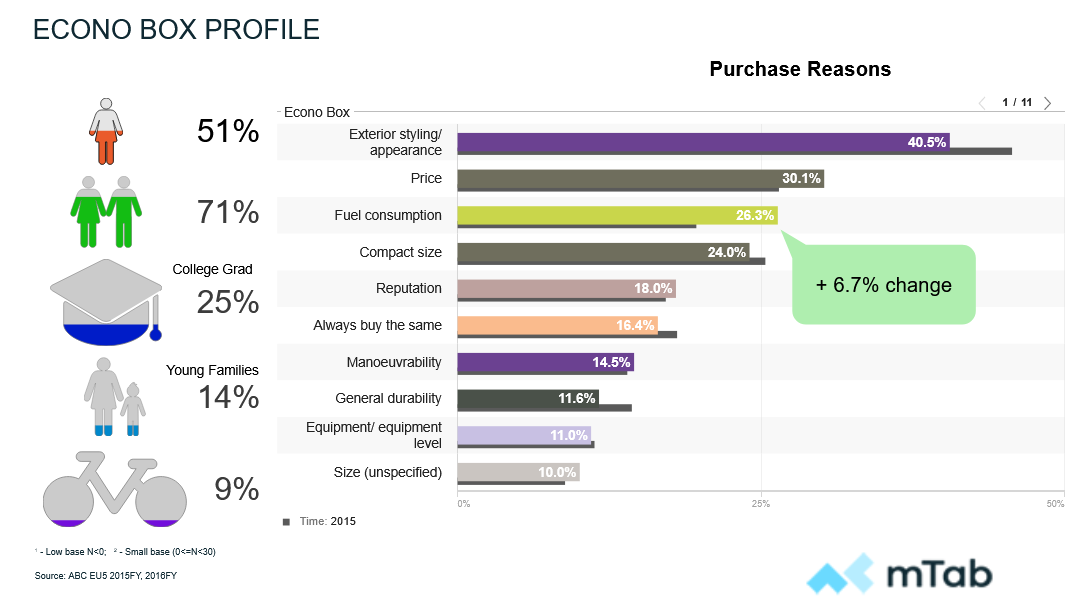
Continue to add additional content to the slide.
This example includes a frequency analysis chart, multiple widgets, a shape, multiple text fields, and an image.