In terms of statistical tests, there are two main scenarios available on the Query side.
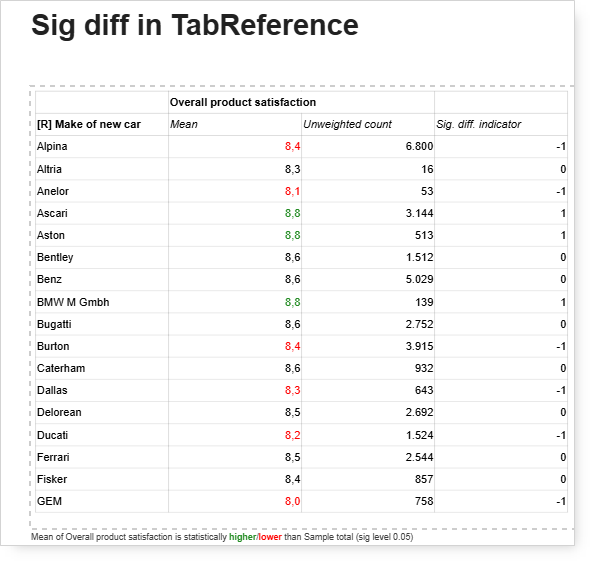
Firstly, you can define the significant difference in calculation vs. specific cells. In such a case, the result of such a test can be retrieved by Significance difference indicator property which will return values -1, 0, or 1. Note that the indicators are in line with the colors applied to the values (-1 = red, 1 = green).
This value can be used for example to define the conditional formatting rule for the cells:
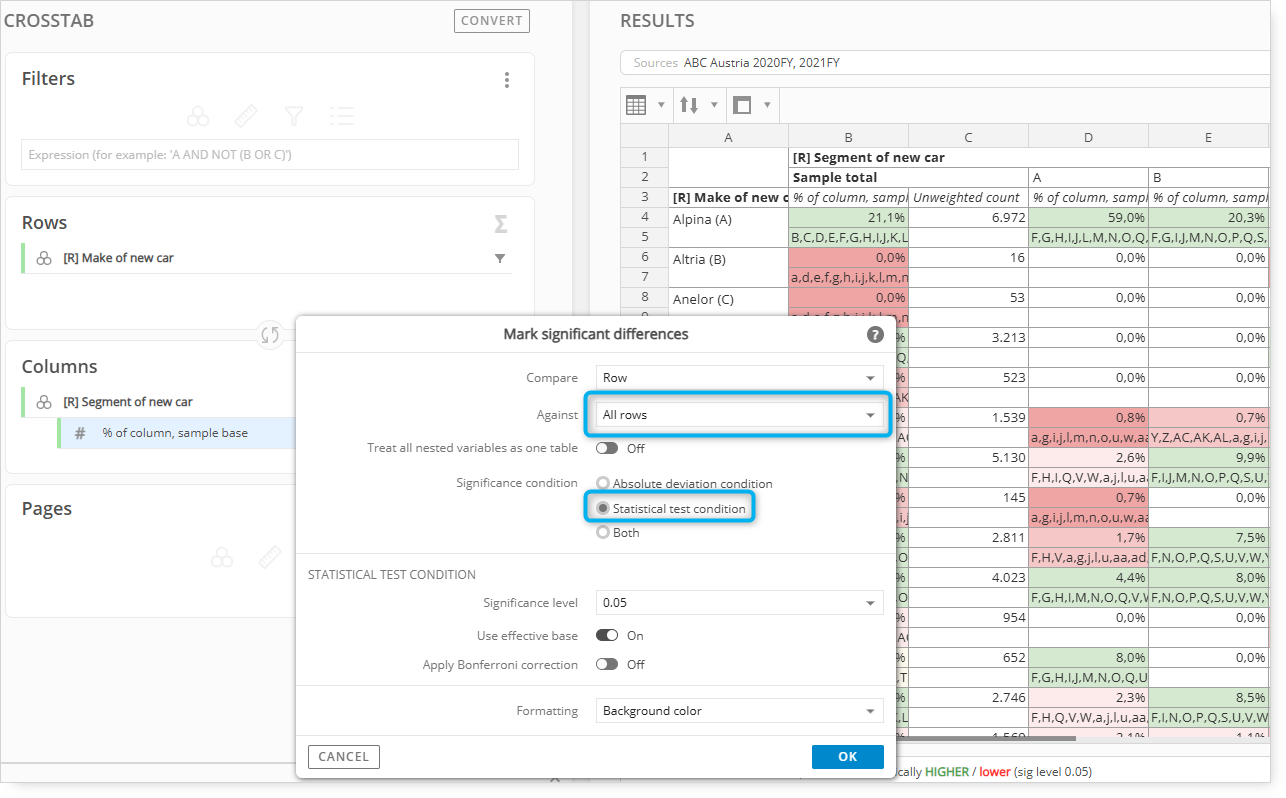
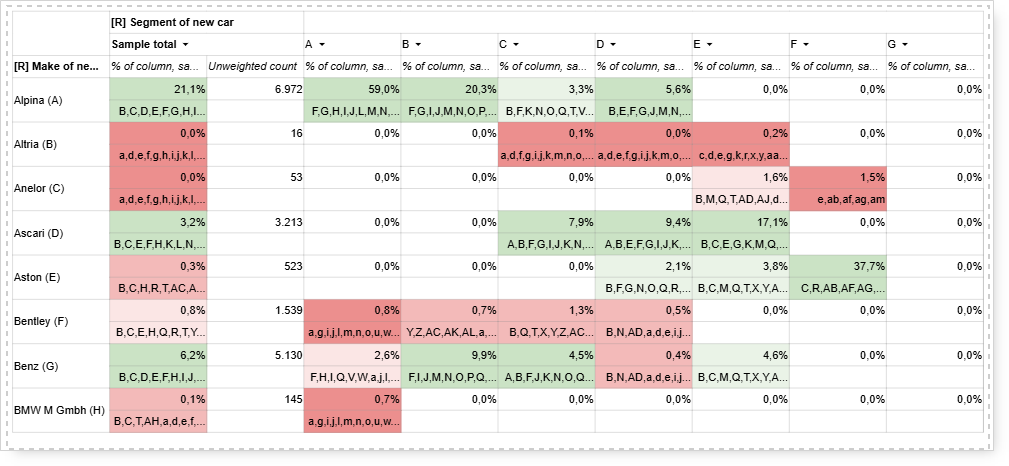
Another scenario is to define the significant difference vs. all rows/columns. In this situation, next to cell formatting (which can now have up to 7 different states), Query adds two additional pieces of information to the Query results - additional Code for each row/column and additional cell listing the significant differences vs. given codes.
In this scenario, each of the 3 properties can be retrieved by TabReference:
“Sig. diff. indicator” returns a value between -3 and +3, depending on the “strength” of significant difference (see manual for a definition of rules behind the colors).
“Sig diff comparisons (vs. all)” returns the text from an additional cell (listing test results vs. each row/ column).
“Sig. diff. reference ID (vs. all)” provides the code used to identify the given row/ column.
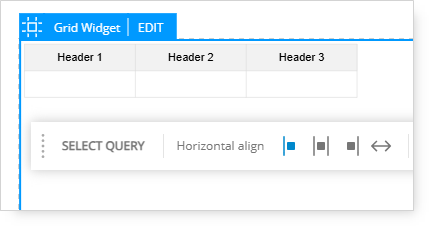
You can see below that the two latter properties are used automatically in the Grid if SELECT QUERY is used to replicate the Query in Grid.
1. Add Grid to Page.
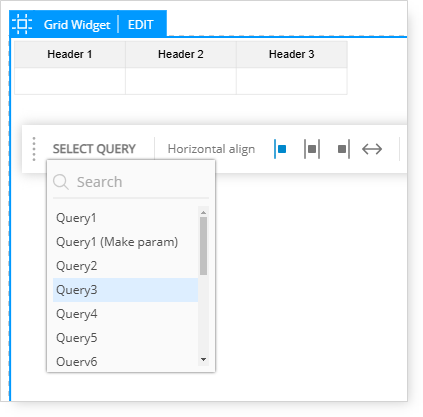
2. Choose Select Query.
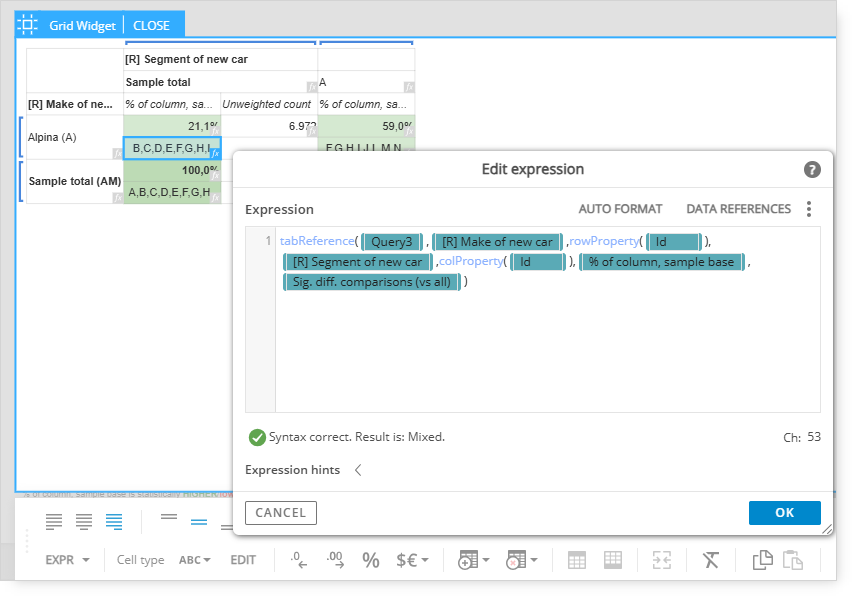
The following demonstrates how this works for the cells, and for the conditional formatting based on indicator value.
Click Edit at the top of the page and then select the cell for which you want check the expression.
1. In this example, we are verifying the expression behind the significant difference cell.
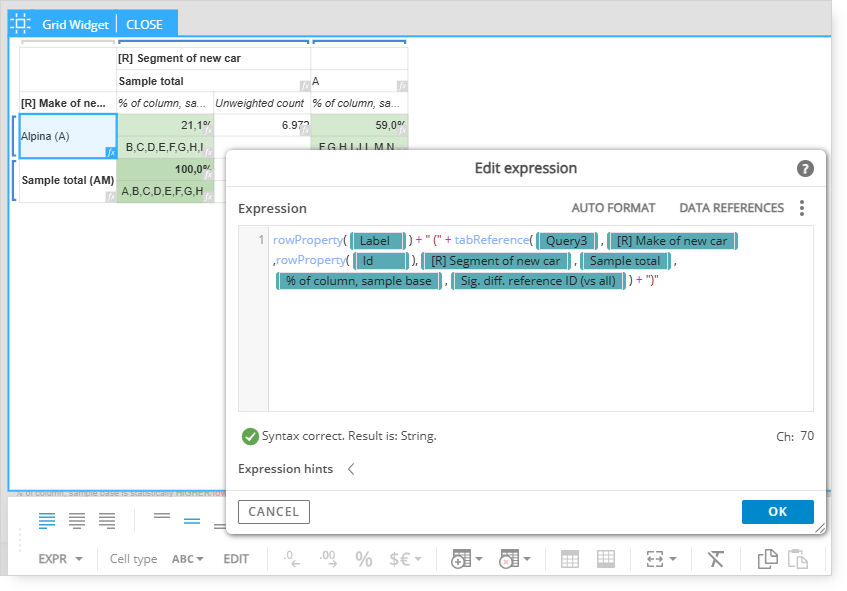
2. Here, we are verifying the cell where the name label of the make is displayed.
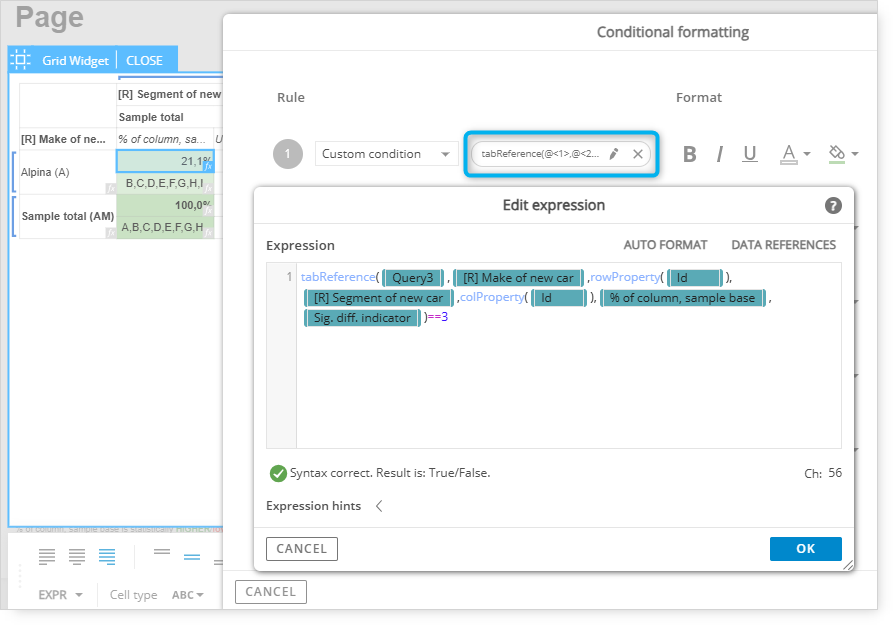
3. In this last example, we are checking the expression behind the conditional formatting.