TabReference - Dynamic Rows and Columns
In addition to retrieving a value related to a single cell, TabReference provides the possibility of retrieving a set of cells. The expressions manager also has additional functions that allow users to work with bigger output. Since the most common use case here would be Dynamic Rows/Columns in Grid Widget, let’s look first at the idea behind this specific Grid feature.
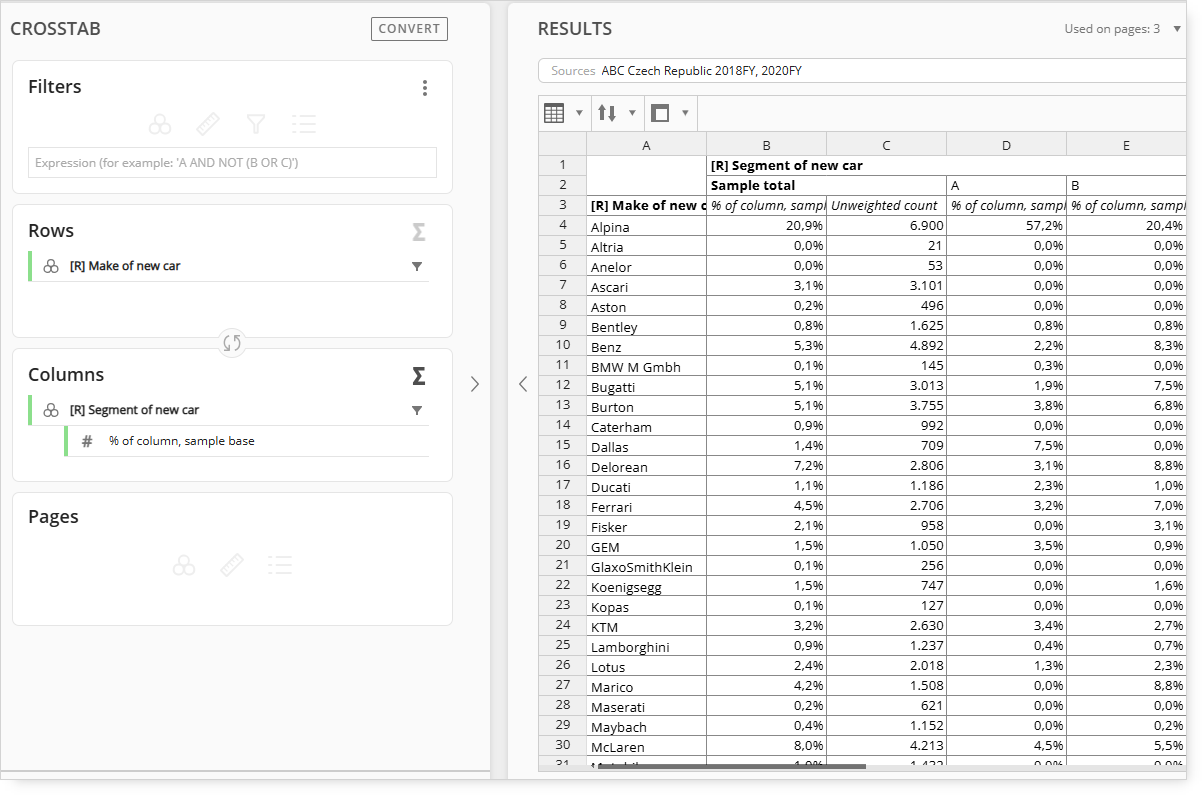
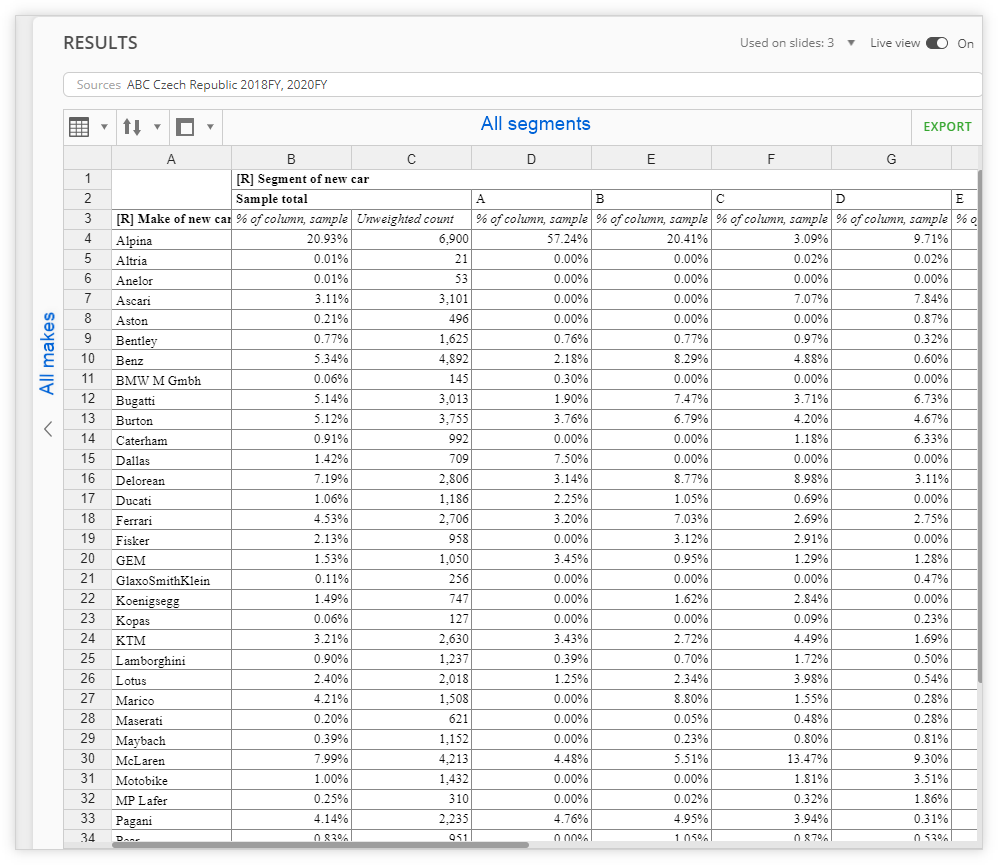
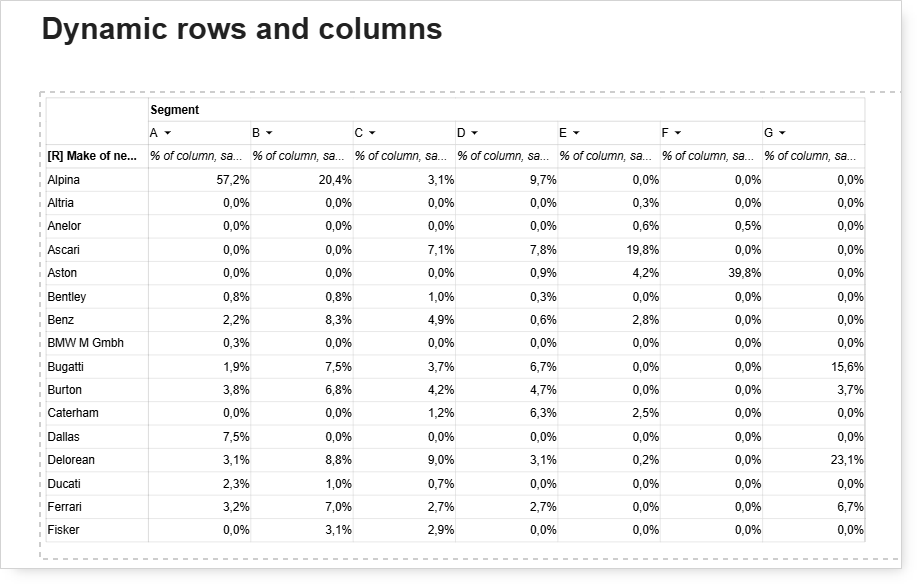
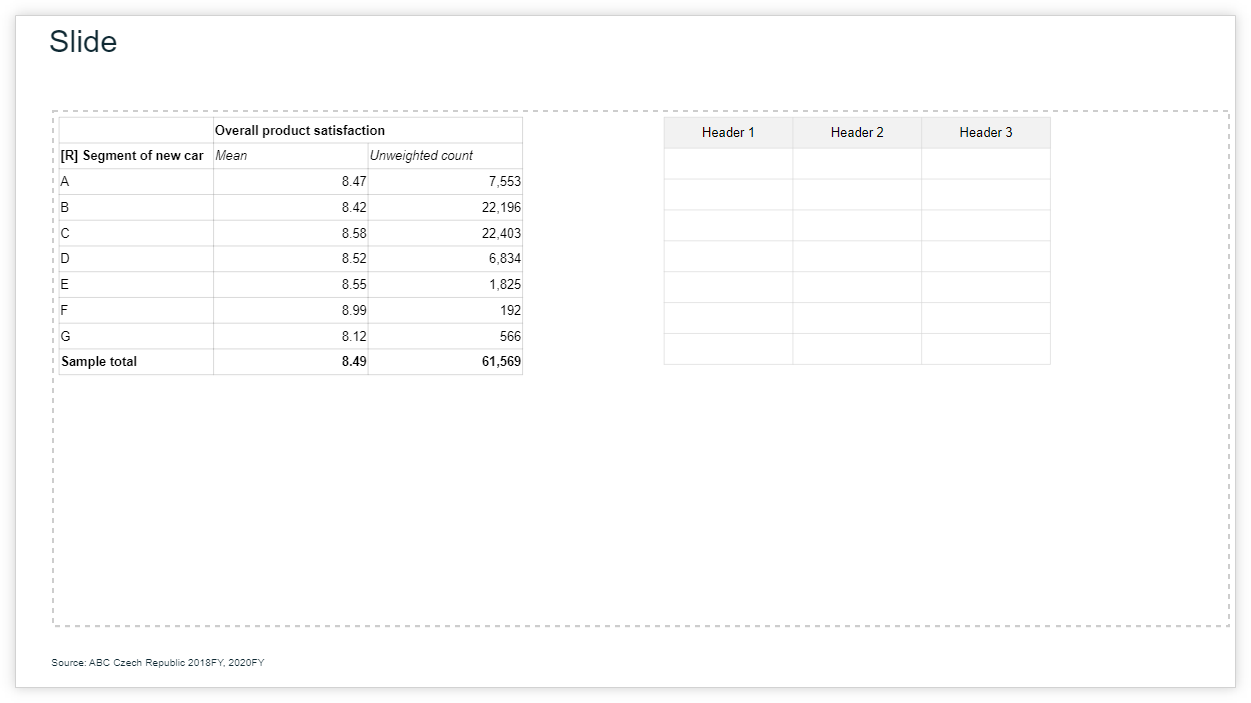
When building a tabular report, it is not always possible to have a static and predefined definition of the rows and columns that will be utilized. While there are cases when the user knows that what is needed is for example a 4x3 matrix with very specific information in each of the 12 cells, a common scenario is one when we want to have all available values from a given question included in the table. If we analyze the make of a new car, the set of makes available can differ between years and countries and it would be very time-consuming to prepare a different table definition e.g., per each country report.
To facilitate report preparation in this scenario, the Grid Widget allows defining so-called Dynamic Rows/Columns. Let’s take a look at the following example.
When you switch datasets in the connection, the Query definition remains unchanged (Makes vs Segments), but the list of rows and columns can vary. If in Compose, there would be a Grid that would refer to these specific sets of rows and columns, it may not show all data (or show redundant rows and columns) when the connection is changed (e.g., by changing Country with a parameter). Therefore, from a table structure perspective, we want it to be defined in the following way:
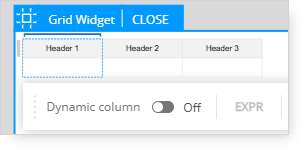
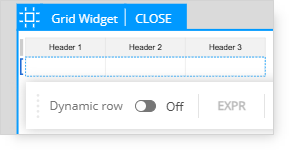
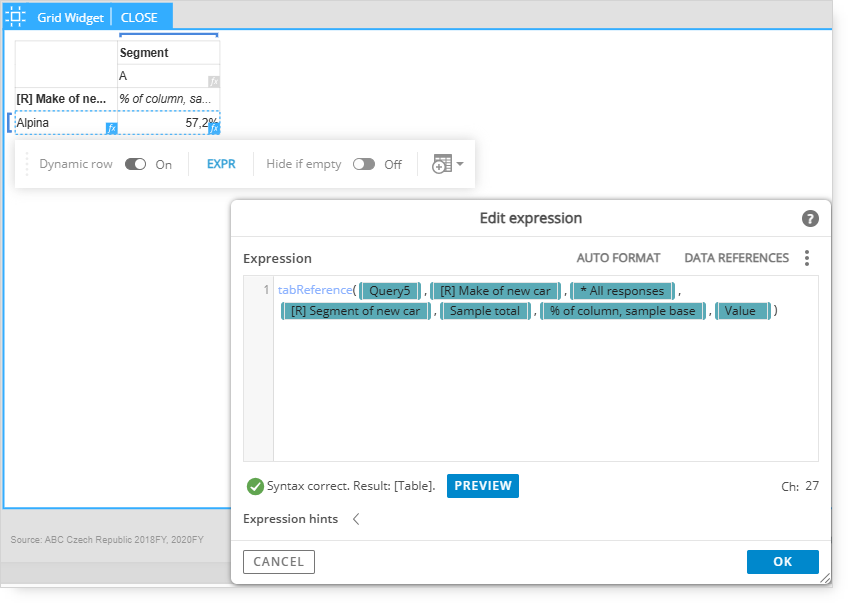
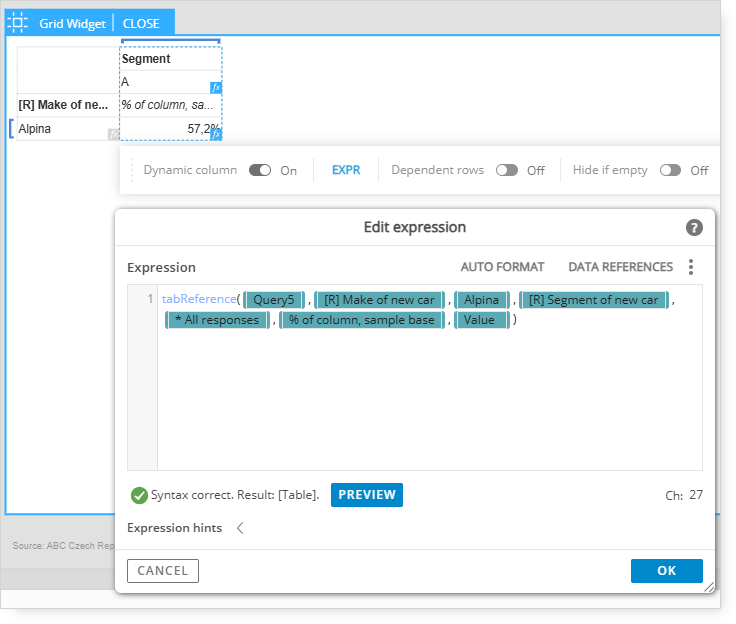
When editing Grid, certain row(s) and column(s) can be marked as “dynamic.” To show the dynamic row/column menu, click on the brackets at the beginning of each row/column. When multiple cells are selected, they can be defined on multiple rows/columns at once (see the blue brackets in the screenshots).
Dynamic rows/columns allow expressions to provide a table of data rather than just one specific value, and they are then able to fill in the grid with as many rows/columns as coming from the expression result. In the end, rather than having each row and column defined separately, we can have our example defined in Grid in the following way:
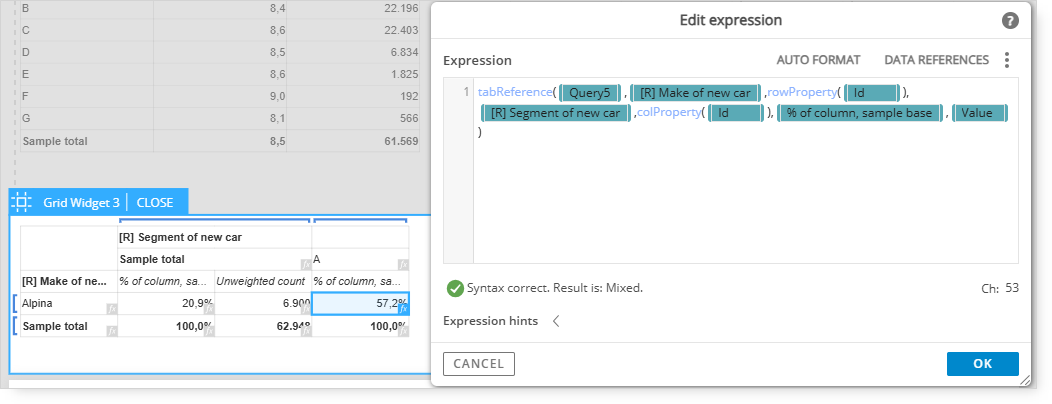
This is the expression under the dynamic rows:
Here is the expression behind the dynamic columns:
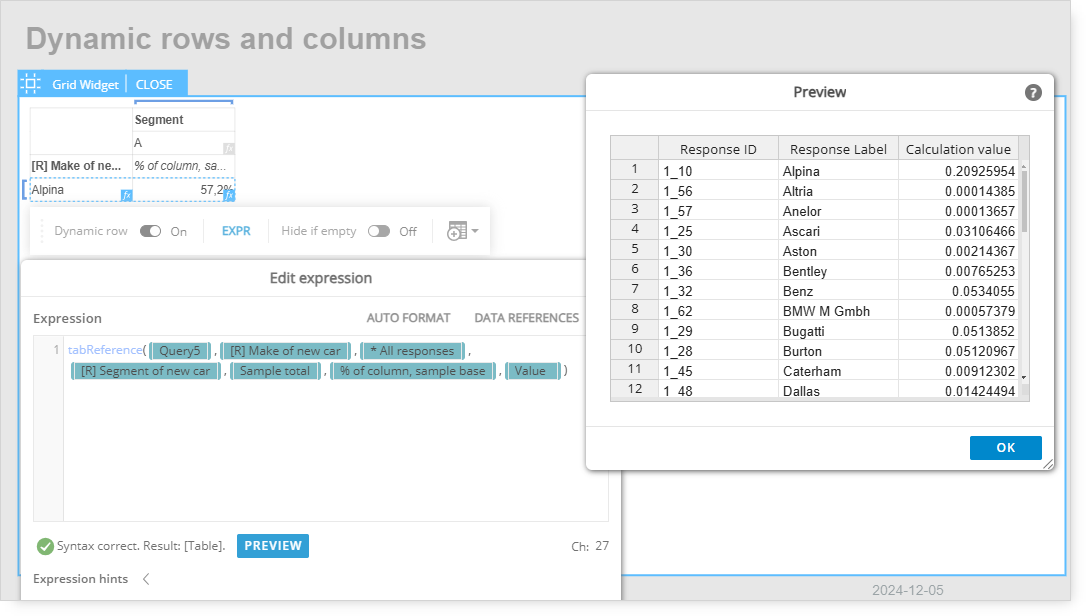
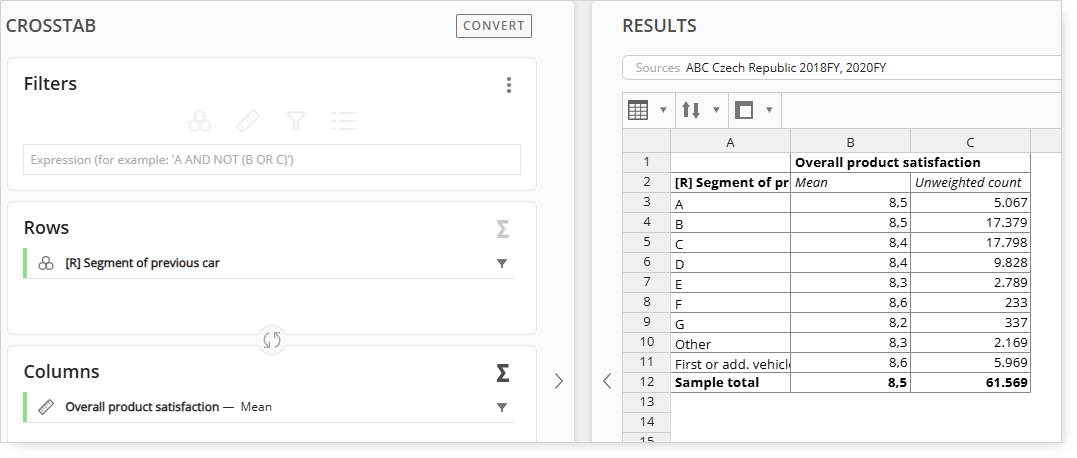
You can notice that the expression manager allows previewing the result when defining the dynamic row or column. In our case, the preview looks as follows:
The results of such expressions always follow the same structure. We receive a list of rows, where for each row there are exactly 3 columns - id, label, and value - based on the cell definition in the original Query. This kind of output type is called “Table” in Compose. Additional functions can be used to further transform the Table output for dynamic row/column, as long as the output remains in Table format.
It is important to understand that such a Table created behind the dynamic row/column translates to Grid structure ONLY (i.e., the number of rows/columns added to Grid), not to the Grid content. The data from the underlying Table are available for the you to utilize in the Grid, but it is ultimately the your decision to determine which data will be added to the final report and how they will be included.
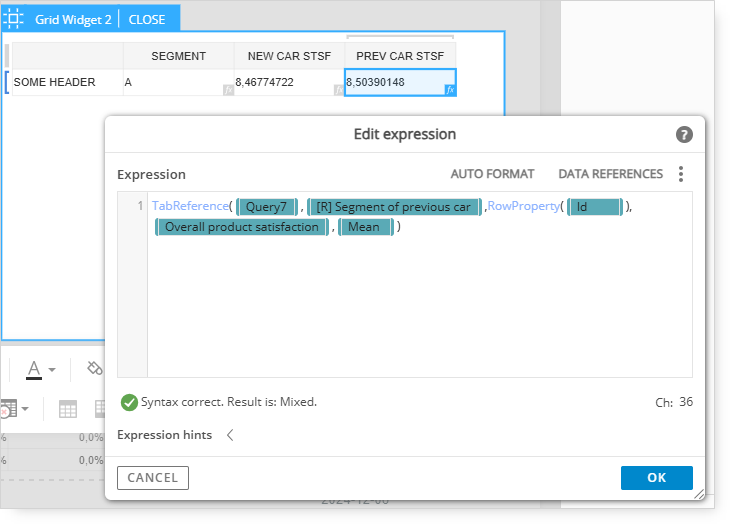
Expressions behind the cells need to use the context of the underlying Table object to have dynamic content. The functions that allow reaching the Table behind a dynamic row/column are RowProperty and ColProperty. Both allow retrieval of any property (i.e., id, label, or value) from a given row/column within the dynamic entity.
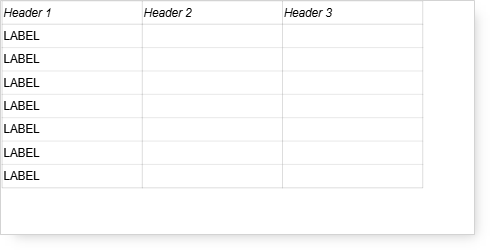
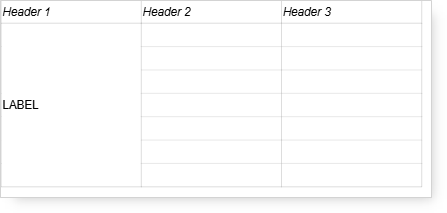
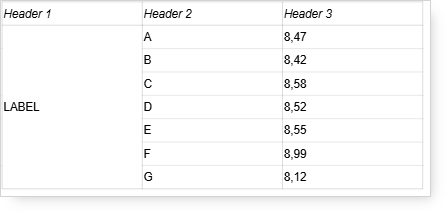
You can see that just creating a dynamic row with e.g., all segments, creates X empty rows within the Grid, each corresponding to one segment from the underlying Table.
See the original Query on the left and an empty Grid with dynamic rows defined for all segments, the preview mirrors the data displayed on the left.
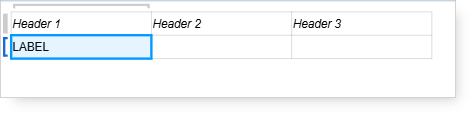
If a static text is added to a cell within a dynamic row/column, it will be copied to each instance of the dynamic row/column.
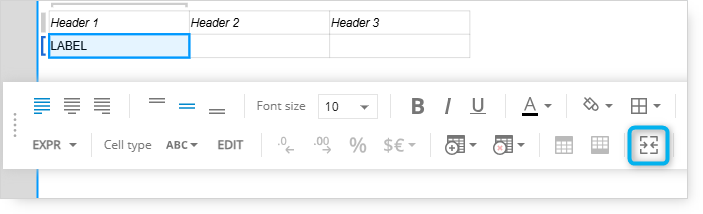
It is possible to merge cells within dynamic row/column, which can be very useful when applying headers in the Grid.
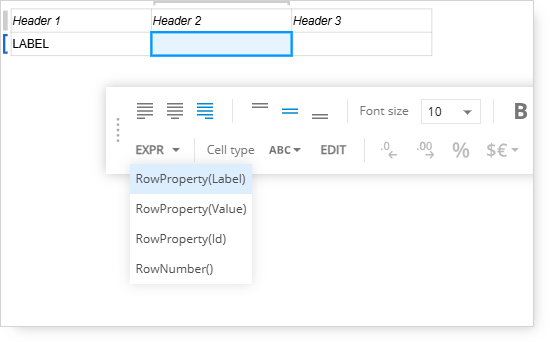
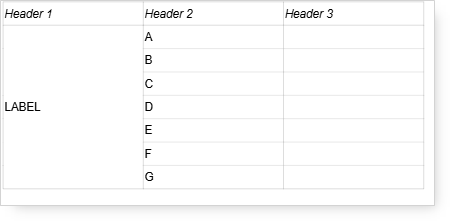
We can add segment labels by using the RowProperty(@label) expression (which is also available as a shortcut next to the EXPR button).
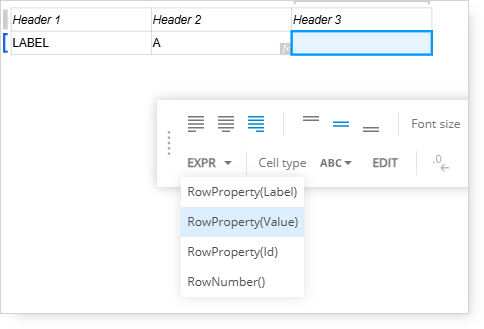
Similarly, values from dynamic rows can be retrieved using RowProperty(@value).
Note that, as in most expressions that have a predefined set of options in their properties, “@” can be used to obtain suggestions regarding filling in the formula.
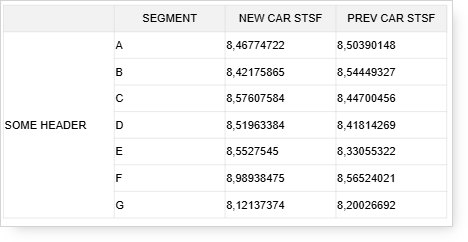
Once we have defined the dynamic row/column, we can use TabReference to retrieve data from other Queries and match them to given rows/columns. This allows you to merge information from various input Queries into one output Grid. RowProperty/ColProperty can be then used similarly to e.g., ParameterValue as the provider of specific question value.
Let’s add one more query, using a different variable for segments (previous car segment).
We can now add data from this Query to our Grid by mapping it with the specific row information from our first Query. For data matching purposes, both label and id can be used in such expressions.
It is possible to use both dynamic rows and dynamic columns in one Grid. In such a case, expressions behind cells can refer to both RowProperty and ColProperty. In our example of Makes vs. Segment analysis, we would have both dynamic row and column.