Compose allows users to include customized shapes in pages.
Use the Shapes feature to complement the visualizations in Compose.
After creating a visualization in Query, go to Compose to create a page and add one or more visualizations to the page.
Shapes are available in the upper left, under the Basic Visuals menu.
In addition to the available shapes gallery, line options and an overlaying text field are also available.
Select a shape, line, or text box and drag it onto the page.
There is a possibility to move the shapes by using arrows on a keyboard.
Pressing any arrow moves components by 1 unit in a given direction. Pressing any arrow with shift moves components by 10 units in a given direction.
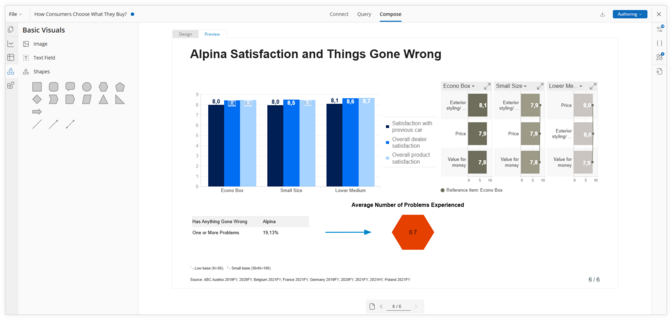
This example illustrates the following included in the page:
-
-
-
Text box “Average Number of Problems Experienced”
-
Data Expression ‘0.7’ (more details on this below)
In addition to including shapes, users can also use expressions to create dynamically linked references to data points or text, so when changes to the dataset occur, the linked references will automatically update.
In the red hexagon example above, the average number of problems, ‘0.7’ is linked to the data and will change when the dataset is updated.
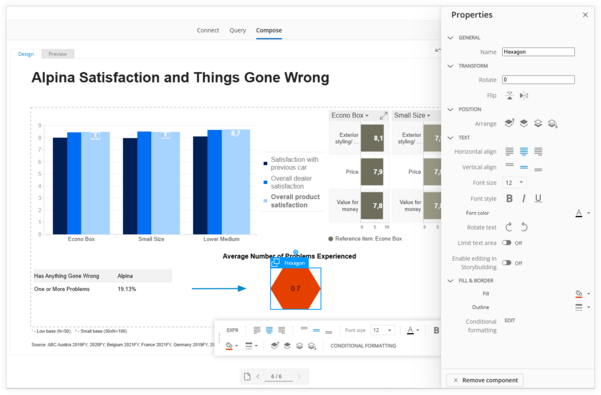
Shapes can be formatted by selecting the properties options on the right side of the screen under the pencil icon.
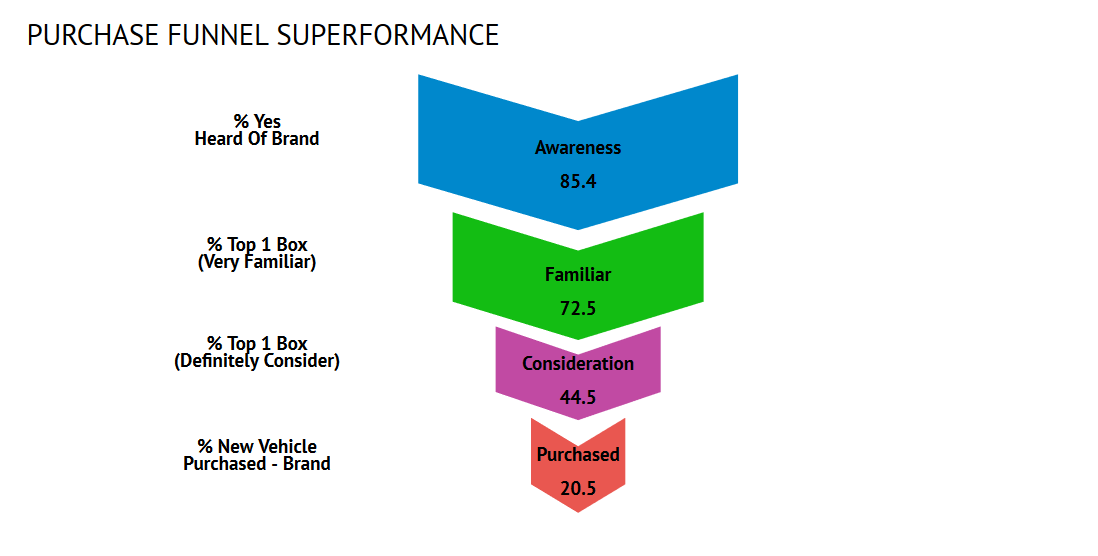
Shapes can also be included on a page without a visualization.
This example shows the use of expressions to link data points from different questions to create a purchase funnel.