Placing Charts and Objects on Slides
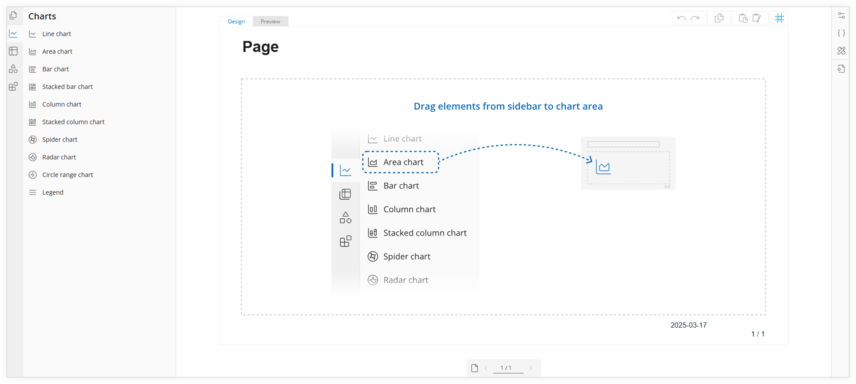
In Compose, you can use charts, queries, basic visuals, and advanced visuals in your project. To place charts and objects on the page, you need to drag the selected item from the menu area (left ribbon) and drop it on the page (inside the dotted rectangle) of the Design Mode panel.
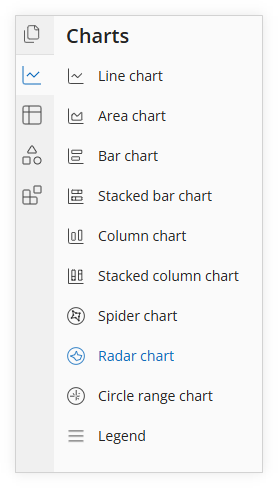
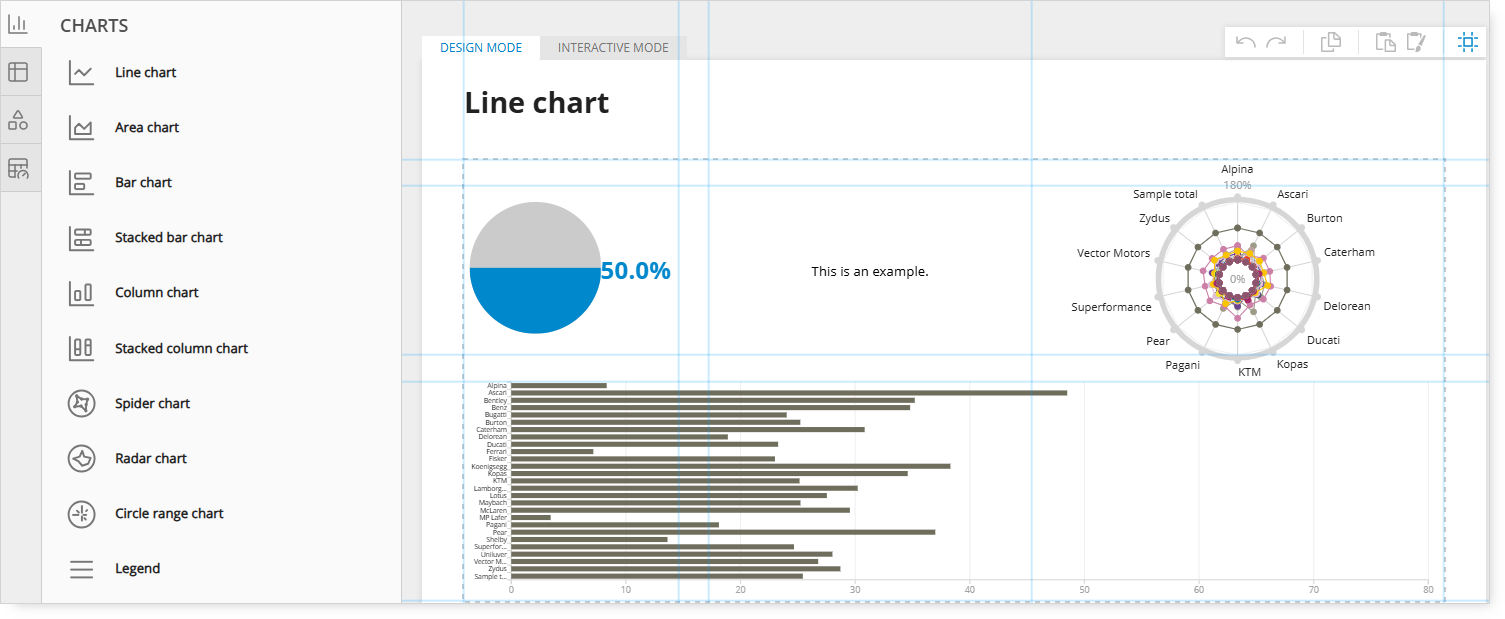
Charts
Below you will find all the charts available in Compose.
By default, the page's name follows the type of chart selected. For example, if you drag and drop a Line chart to the page, it will be named Line chart unless you change that in the Properties section.
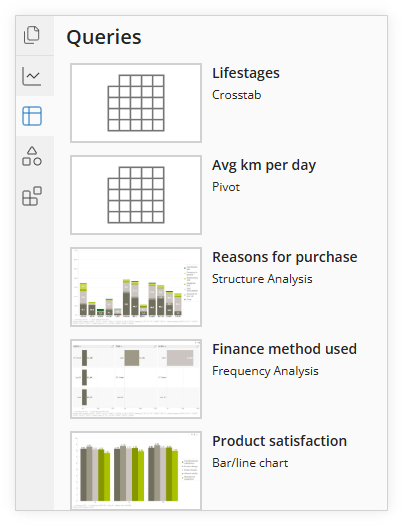
Queries
The following is a list of charts and tables that were previously created in Query.
Each visualization will be named. If no name is specified, 'New tab' will be assigned as a name by default.
Each tab's name is accompanied by a description (e.g., Crosstab, Pivot, Structure Analysis).
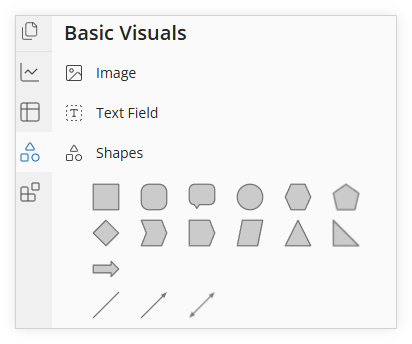
Basic Visuals
Click the Basic Visuals icon to add a text field or image to the page.
Select a text field or image from the menu and drag it into the Slide Compose (inside the dotted rectangle) region.
Note: A text field or an image can be added to the Slide Compose Area. If you want to add it outside the Slide Compose Area, use floating mode. More about floating and non-floating modes can be found
here.
In order to edit the content of the text field, double-click on the Text field area.
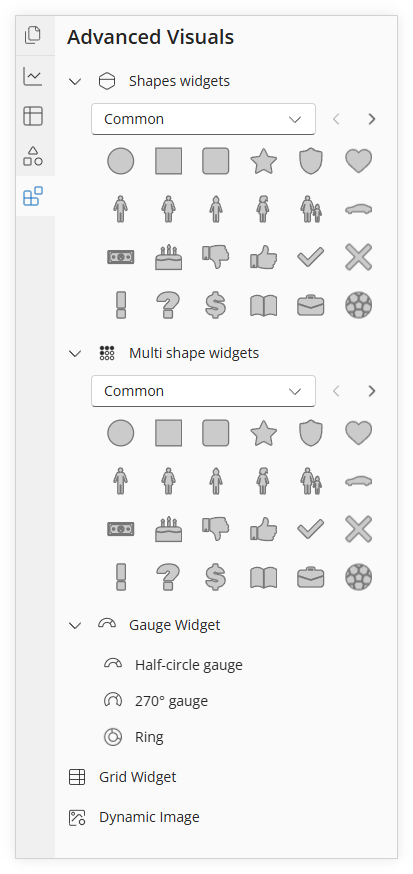
Advanced Visuals
Multiple charts or charts and tables, along with text boxes (and images) can be included on the same page (see the example below).