How to Add and Edit the Legend?
To enhance your page, you can include a separate legend component, which gives you a complete freedom for positioning this component on the page and allows you to link a single legend to multiple charts. What is important is that the legend component operates independently and that is why it is not an inherent part of a chart. This component is located in the left ribbon of Compose. To add the legend to your page, you need to navigate to the left ribbon, locate the legend component, and drag and drop it onto your page. The legend is used to provide context for charts by associating labels with data points.
How to link the legend to a chart?
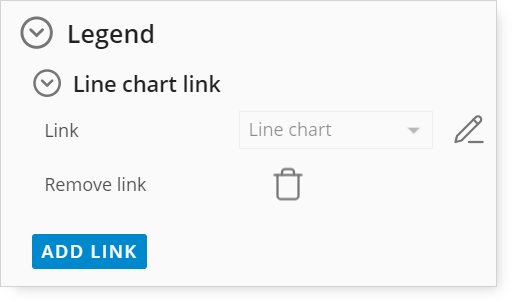
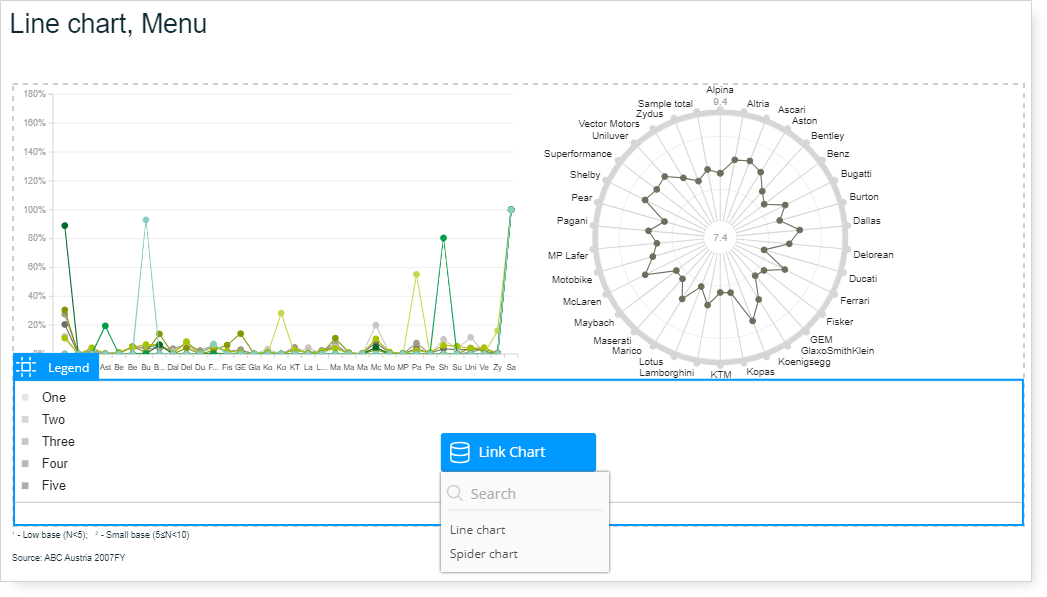
After adding the legend component to your page, you can link it to a chart by using the Add Link option. This linkage is important because it allows the legend to display information related to the chart. The linked legend will always display information displayed on a given chart, e.g., if you change the list of items it will be automatically adjusted, the same will happen if you change the color palette or chart type (this will affect indicator in the legend.) You will need to specify which chart the legend corresponds to. This is done through a simple link selection. If you want to use a Link chart, you must have at least one chart on the page, as only the charts from this particular page are listed in the dropdown menu when you click the Link chart option. There can be more links to one legend.
Using Add Query in the Legend Section
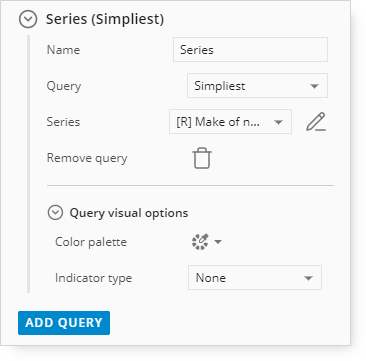
Add Query differs from the Link Chart feature. When you use the Add Query option, you can link the legend directly to any data from the query. This allows you to create a customized legend that aligns with your requirements. You can manually adjust this legend so that it is coherent with the current displayed on a given chart. When you use the Add query option, additional settings become available under the Legend settings. This is because Add Query links to the query, not the chart. Consequently, any settings configured for the chart will not automatically appear in the legend unless you make manual adjustments.
There are as well visual option that can be used, these are:
-
Color palette: here you can customize the colors of the displayed data;
-
Indicator type: here you can change the indicator to a different shape, e.g., square, box, half square, cut square.
How to edit the legend?
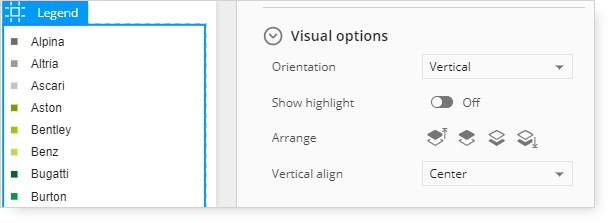
Once the legend is linked to your chart via Add Link or Add Query, you can customize its appearance and behavior. These customization options are located under "legend settings." These settings allow you to control aspects such as:
-
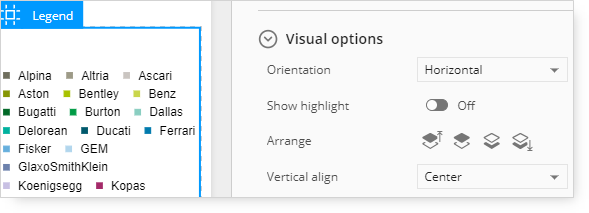
Orientation: here you can align the legend elements by selecting either vertical or horizontal orientation.
If you select vertical orientation there will be just one column presented, if not all items are visible then you can switch to Interactive mode and scroll the list there:
If you select horizontal orientation:
-
Show highlights: if you activate this option, you will have all the highlighted items on the linked chart bolded in the legend.
-
Arrange: arranging the legend position against other elements on the page.
-
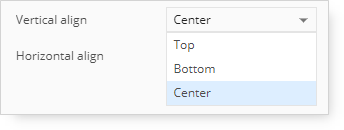
Vertical align: it arranges the content of the legend according to the selected vertical option, i.e., top, bottom or center.
-
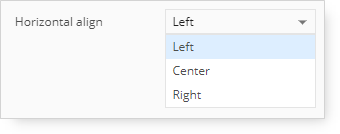
Horizontal align: it arranges the content of the legend according to the selected horizontal option, i.e., left, center or right. Available only if you select horizontal orientation in the Legend options.