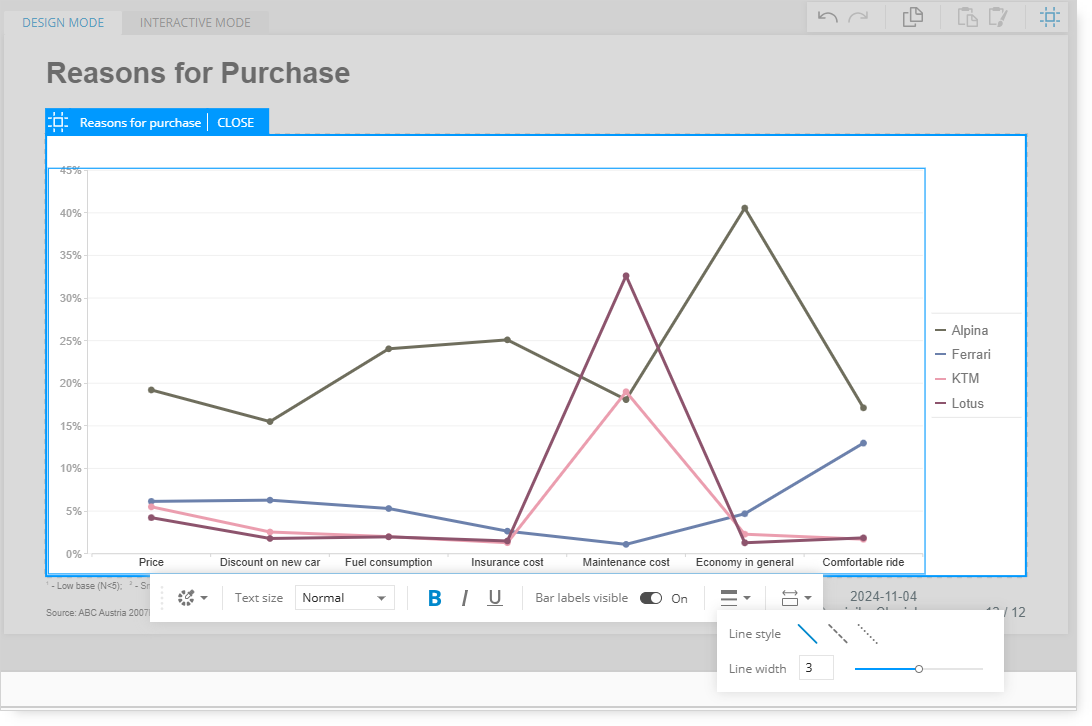
Editing visualizations is supported directly within Compose.
Editing a visualization through the Edit mode in Compose is a more seamless, integrated process.
As changes are made, the updates to the visualization can be viewed immediately.
To enable Edit mode on a visualization, start with the following steps:
1. Add content to a page in Compose;
2. Remain in Design Mode;
(Interactive Mode does not support editing.)
3. Click on the visualization within the page to enable Edit mode.
(A blue Edit tab will appear in the top left corner of the visualization.)
4. After clicking Edit, a toolbox will appear beneath the visualization.
This toolbox is available when editing the following visualizations:
The available options in the toolbox will vary depending on the visualization.
However, a standard set of editing options is available when editing any of the charts:
-
Selecting a different color palette;
-
-
Changing the font style (bold, underlined, italics);
-
Adjusting the scale and decimals;
-
Amending line style and width;
-
Adjusting axis parameters;
-