Compose enables you to create dynamic, data-driven pages by utilizing data queries and a range of design tools to craft reports. Each element you place in Compose can link directly to data defined in the Query module, ensuring consistency and real-time updates. With Compose, you can:
Add visualizations from a variety of charts, all of which pull live data from queries.
Adjust text, colors, fonts, column widths, and more to fit your report's aesthetic and functional needs.
Link page objects to data or adapt reports dynamically using expressions and parameters.
Incorporate Grid, Shape, Gauge widgets to structure and highlight critical data.
Use features like dynamic images and TabReferences to display context-sensitive visuals and values.
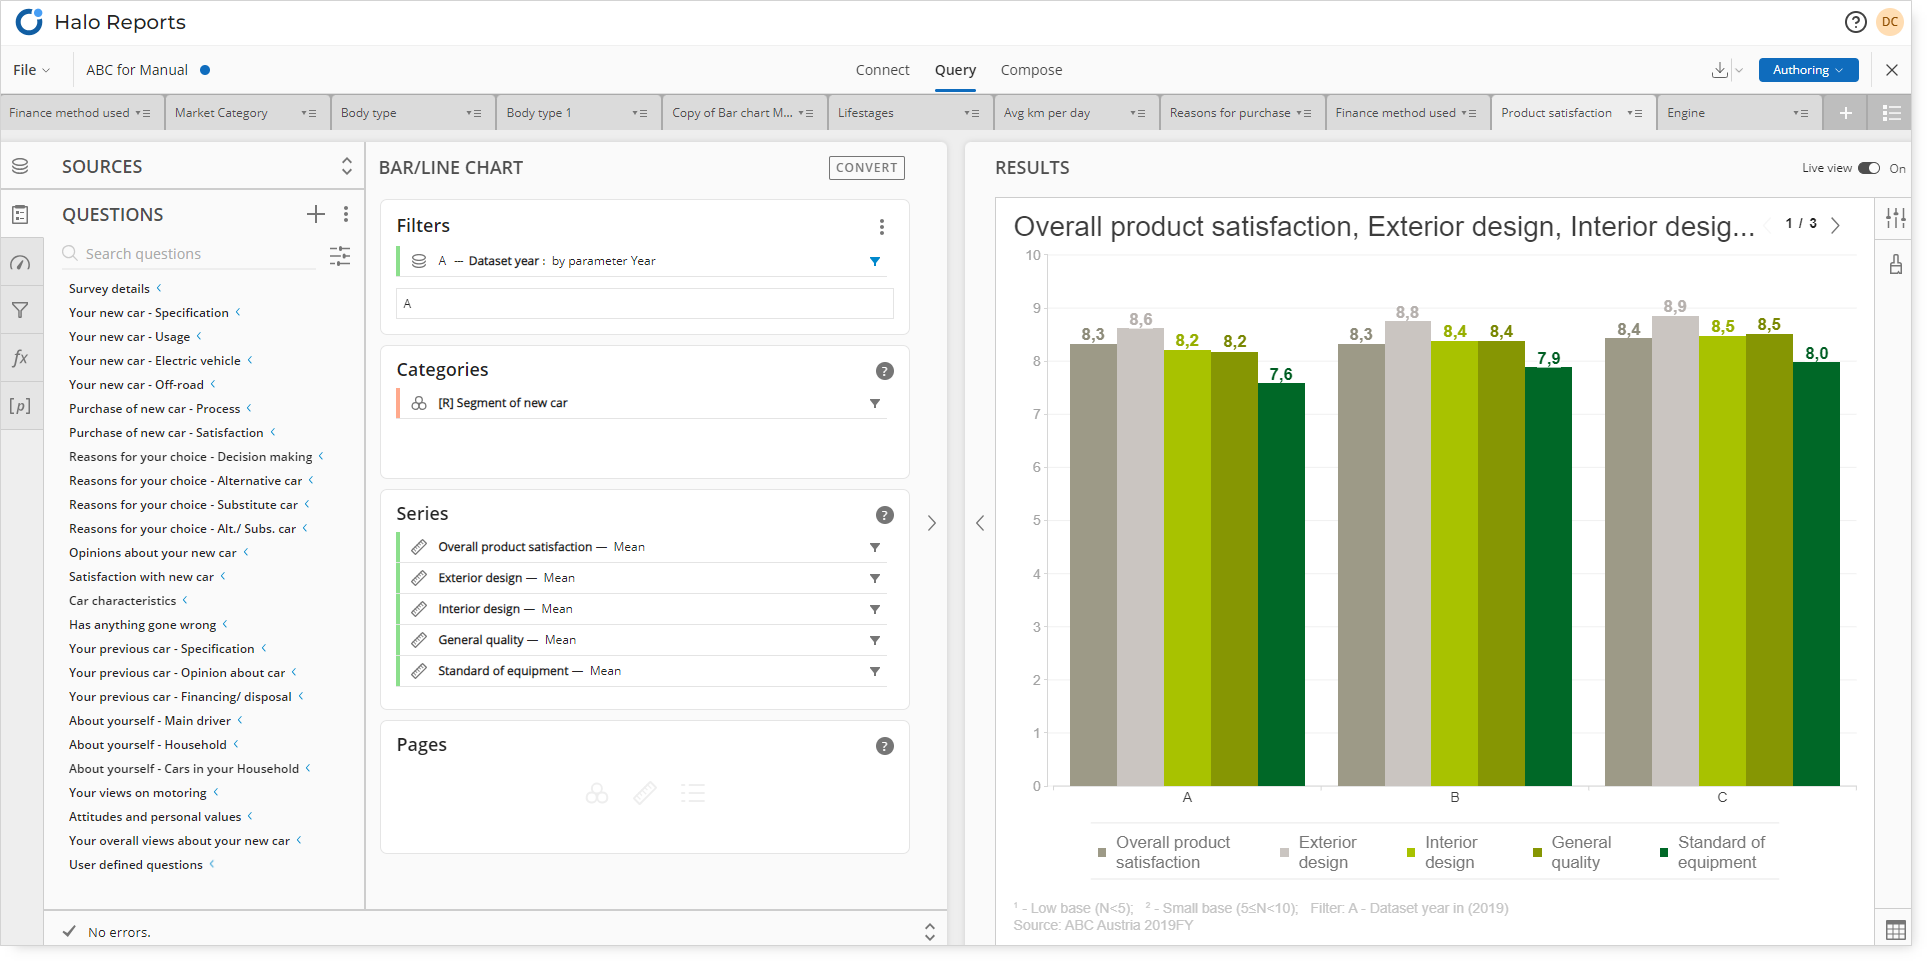
Prior to using Compose to build pages, chart, and table content will need to be created with Query.