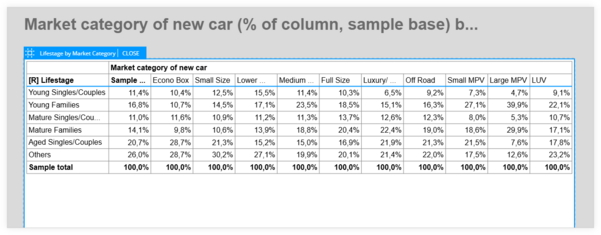
To add borders to the table, hover over the existing cell border area that should be formatted.
A solid blue line will appear.
Notice the line below the column headers.
Click the solid blue line to bring up the border toolbox options.
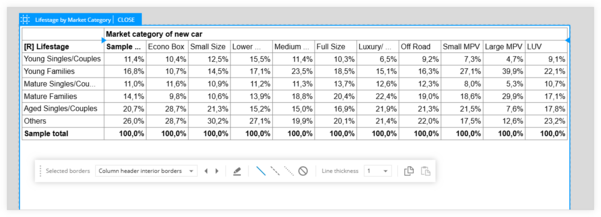
Note: The border and standard formatting options are activated separately through different actions and appear in separate toolboxes.
After clicking the solid blue line, the border options appear.
In this example, the border below the column headers was changed to green and the thickness was increased to “2”.
Notice the blue arrowhead icon located at the corner of the cell to identify what border the formatting is being applied to.
Expand the drop-down menu options to scroll through the different border options or use the left and right arrows next to the menu.
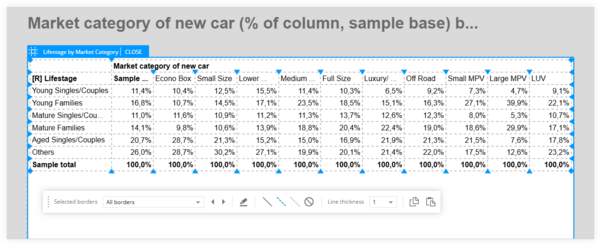
The blue arrowhead icons will change as the different border options are selected.
These arrowheads identify what part of the table border(s) will be formatted.
This example is using the “top border of data region” and “horizontal interior border” options.