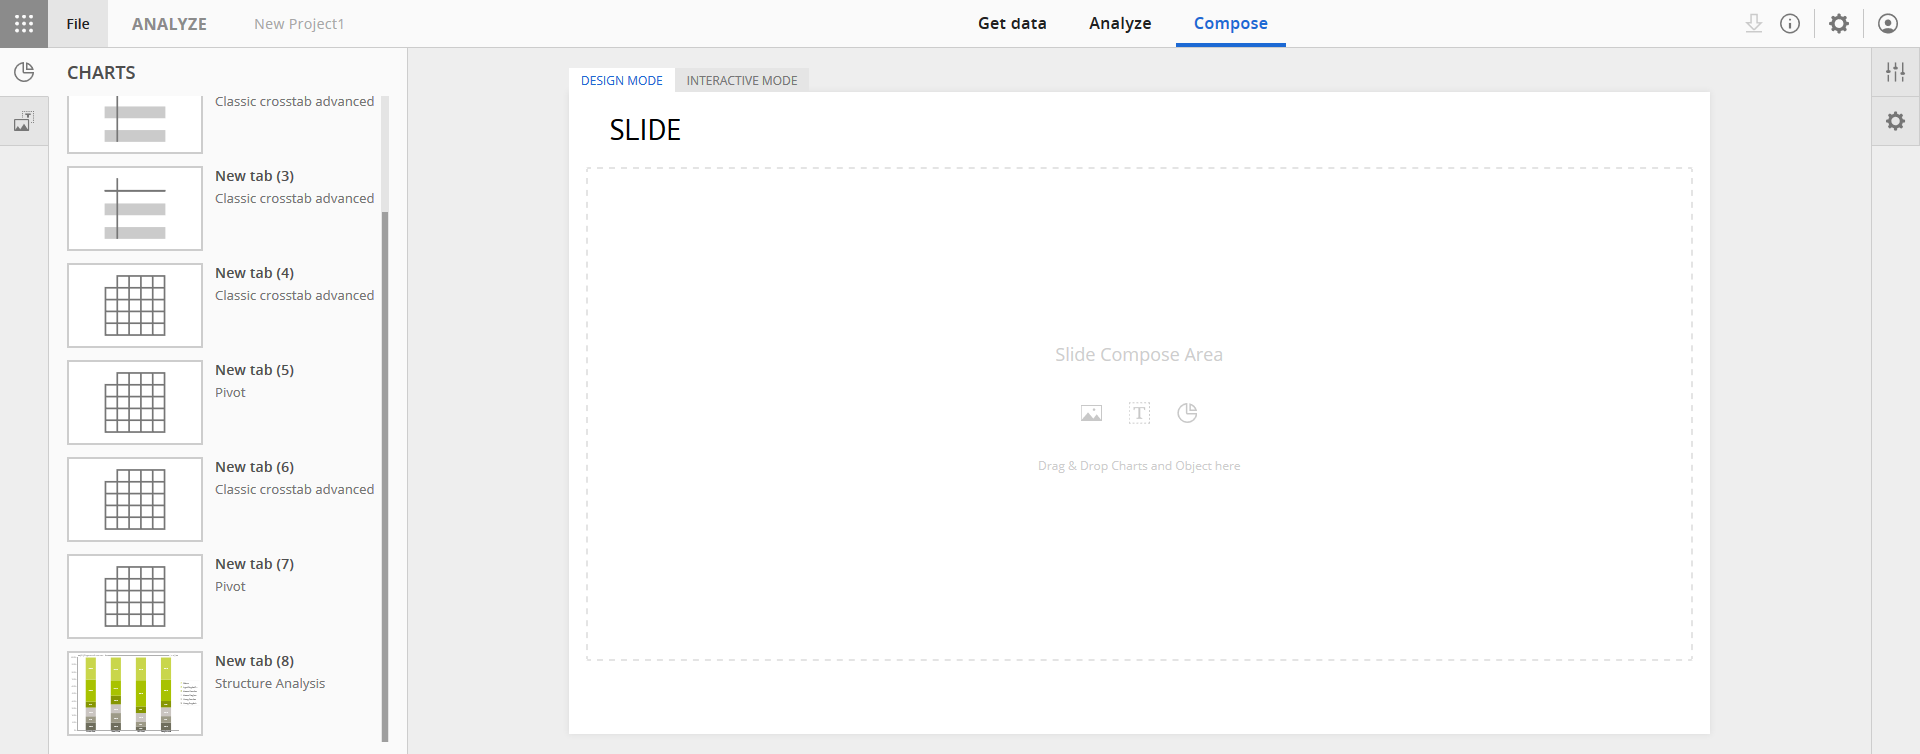
This will list all of the charts and tables that were previously created in Analyze.
Each visualization will be named. By default, 'New tab' will be assigned as a name, if no name is specified.
A description (Crosstab, Pivot, Structure Analysis, etc.) is also listed beneath the name of each of the tabs.
Select a chart or table from the menu and drag it into the Slide Compose Area (inside the dotted rectangle) of the Design Mode panel.
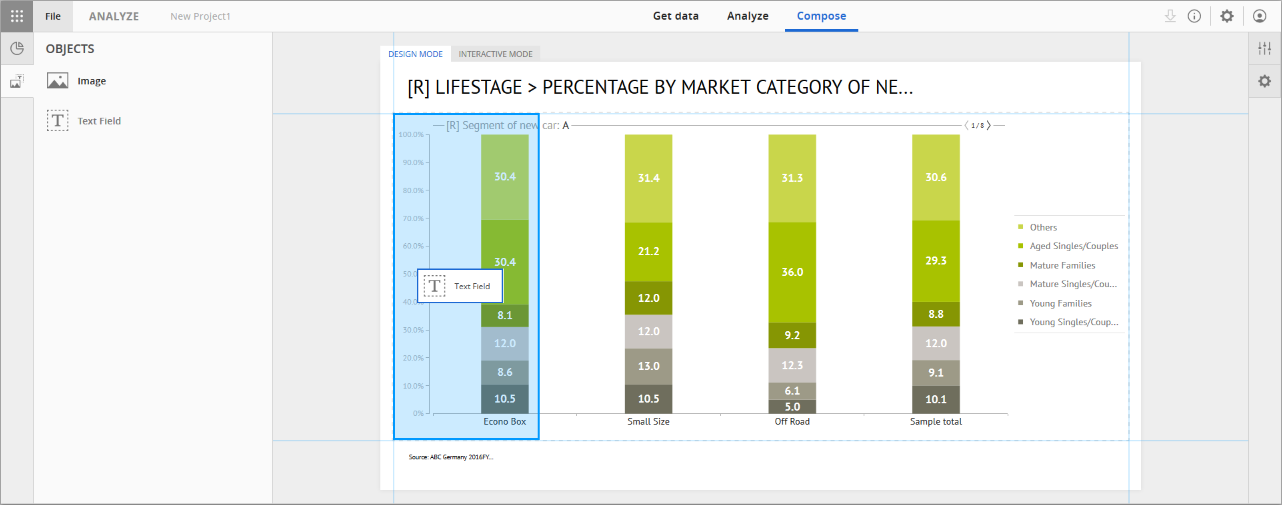
Click the Objects icon to add a text field or image to the slide.
Select a text field or image from the menu and drag it into the Slide Compose (inside the dotted rectangle) region.
Note: Adding a text field or image to the title or footer regions is not allowed.
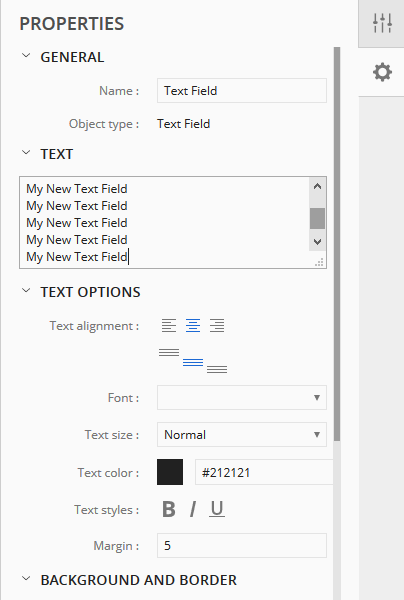
Edit the contents of the text field in the Text Properties window.
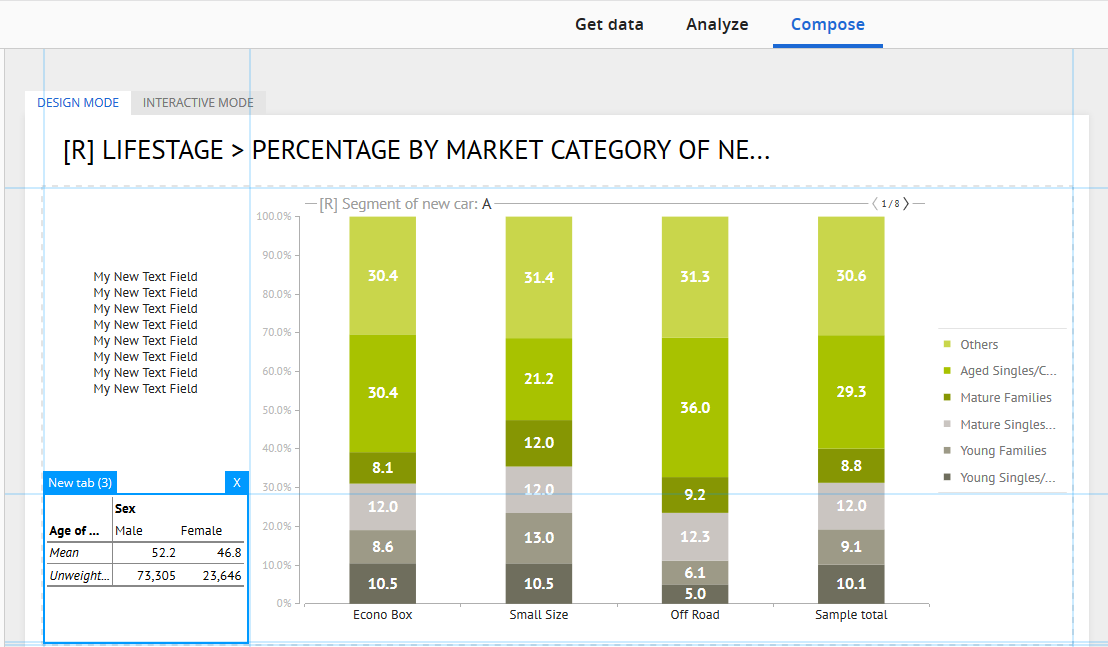
Select an additional chart or table from the Chart list and drag it into the Slide Compose Area (inside the dotted rectangle) of the Design Mode panel.
This example is meant to illustrate that multiple charts or charts and tables, along with text boxes (and images) can be included on the same slide.