Managing End-User Interactions
While building a report, the power-user can customize it to the capabilities and preferences of the end-users who will be using the slides.
Populate the Charts With a Different Part of the Data Universe
There are additional permissions granted to power users that allow for customizing and controlling how the end-users interact with the data on the slides.
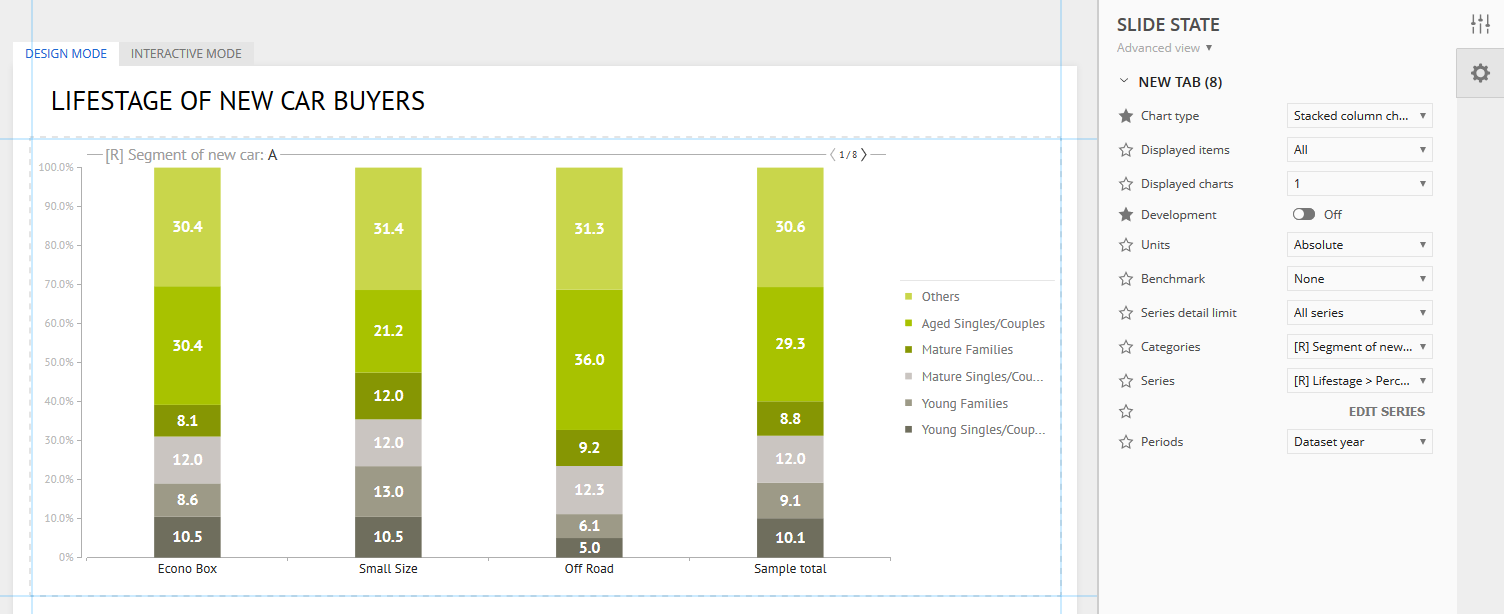
Click the contents on the slide (chart or table), so the compose region is outlined in blue.
After the visualization is selected, click the Slide State icon to expand the menu options.
Experiment with the different settings and controls:
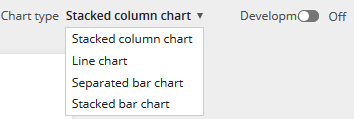
Chart type changes the visualization.
Displayed items controls the number of bars to show.
Displayed charts allows for more than one chart to be included in the visualization.
Development turns on trending over multiple time periods (if applicable)
Categories allows for displaying different questions as bars (if multiple questions are included in the Analyze Category panel)
Series allows for changing the question used in the stacked bars to populate the data points (if multiple questions are included in the Analyze Series panel)
Enabling Slide Settings
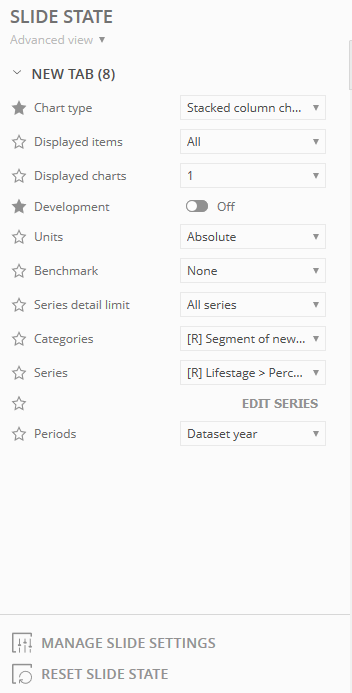
To the left of each slide state setting, there is a star icon.
Each of these can be set by a power-user before publishing.
This star indicates whether or not an end-user can change the options in the slides.
Clicking a star turns on the slide state setting.
In the example above, Chart type and Development are active (stars are turned on), so these options will appear in the slides for end-users to change the options.
The available options for the end-user are everything that is listed in the drop-down menu for the specific slide setting.
Since Chart type and Development are the only options turned on, the end-users will not be able to toggle options for the other menu items such as Benchmark.
As a power-user, setting the options for each of the settings without the star icon turned on means the end-user will see only the specified option in the slide(s), without the ability to change it.
This ability to turn on/off slide settings is available to power-users in both the Design and Interactive mode panels.
Since Chart type and Development were the only slide settings that were turned on, when viewing the slides, controls will only be present to end-users to change these two options.
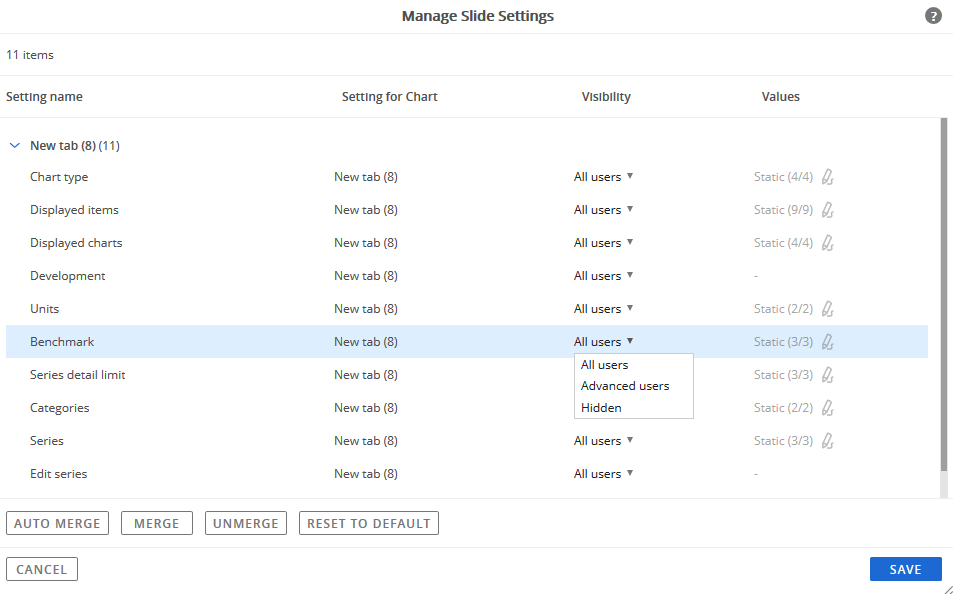
Manage Slide Settings
For additional control over slide settings, power-users can access the Manage Slide Settings options.
This screen lists all of the slide settings and allows power-users to specify the level of end-users that can access each setting.
Power-users can grant Advanced users access to each slide setting.
This allows for more flexibility than the on/off setting.