User Manual
×
Menu

Layout Of Data, Query And Results

 
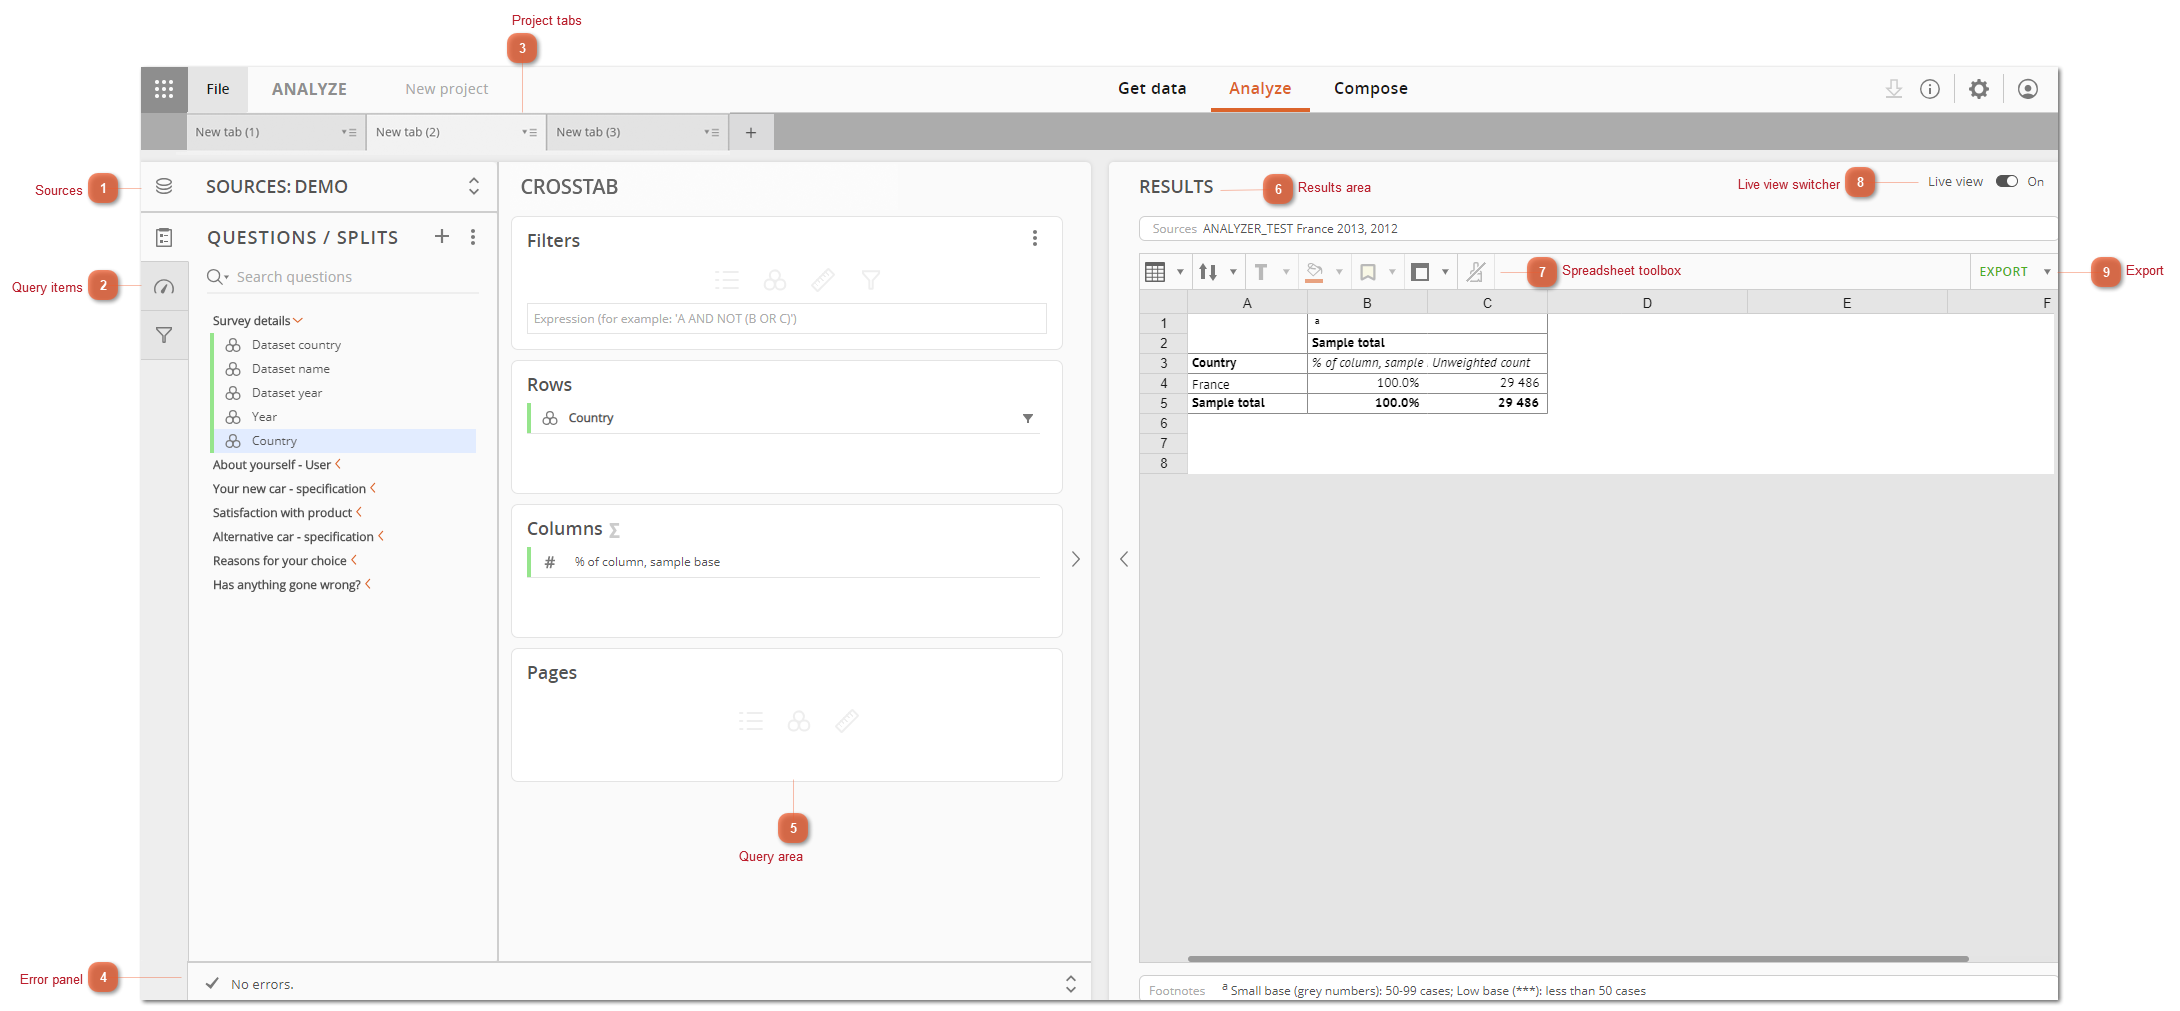
In Analyze, there are two main view modes that you can work with. The first one - "Split view" and the second - "Full query/results". View mode can be set in the global settings in the "interface" section.
 
 
Layout Of Data, Query And Results
 
1

Sources

1. Sources
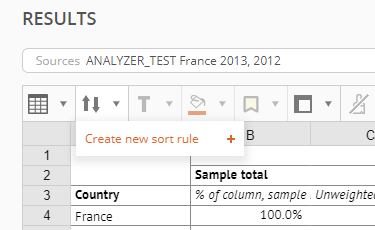
"Sources" field shows you which datasets are included in the current data connection.
2

Query items

2. Query items
From the top: "Questions / Splits", "KPIs and Objects", "User defined filters".
All those tabs contain all the questions and their aggregates from your datasets that are available for you to use in creating the report.
3

Project tabs

3. Project tabs
Active (highlighted) and inactive (grayed out) tab. In each tab you can design an independent query and independent data connection. Details in Tabs and tab settings and in Working with multi-tab projects.
4

Error panel

4. Error panel
Any errors in your query will be displayed in this panel. Details in Error panel.
5

Query area

5. Query area
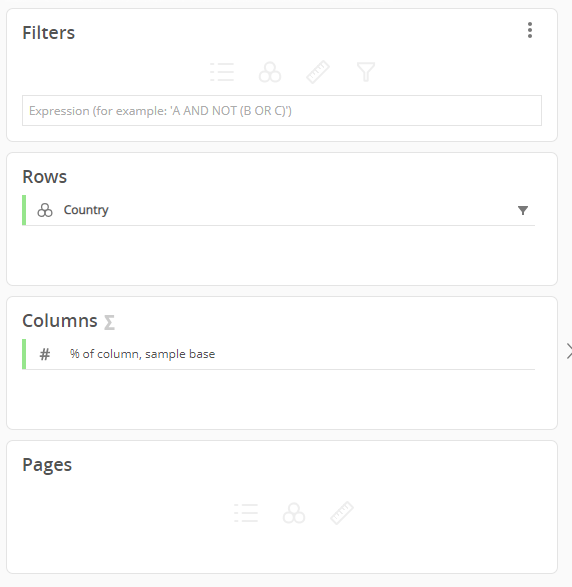
Query area contains panels. You can drag and drop the query items from the left ribbon into them and build your analysis. Depending on chosen tab template query area may look different.
6

Results area

6. Results area
Here you can find the results of your analysis.
7

Spreadsheet toolbox

7. Spreadsheet toolbox
Here you can maintain your spreadsheet layout.
Templates:
Manage your spreadsheet template or decide if statistic labels should be visible or not.
            
 
Defined Sort Order:
Here you can define the sort order of your results.
 
Freeze:
Here you can freeze some rows/columns cells on your spreadsheet.
 
8

Live view switcher

8. Live view switcher
Using this switcher you can decide whether the results should load immediately after you change the query or not.
9

Export

9. Export
Using this option you can export your project. There are two export options.
You can export the current sheet or all the sheets from your project.