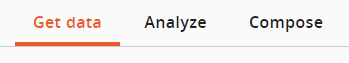
The three main available sections are Get data, Analyze, and Compose.
Use Get Data to create and manage data connections (see Data connections for details).
Analyze is used to query the data and is divided into two modules - Query and Results. Depending on the chosen tab template, results can either be a spreadsheet or a visualization.
Compose allows for creating visualizations from the Analyze queries, adding those visualizations into slides, and exporting them into "My stories".
Once the connection is set in the Get Data section, go to the Analyze section by clicking on the Analyze header on the top bar or by clicking the "Go to Analyze" button in the bottom right corner.
Once the Analyze section is open, the user can decide which tab template to use for analysis.
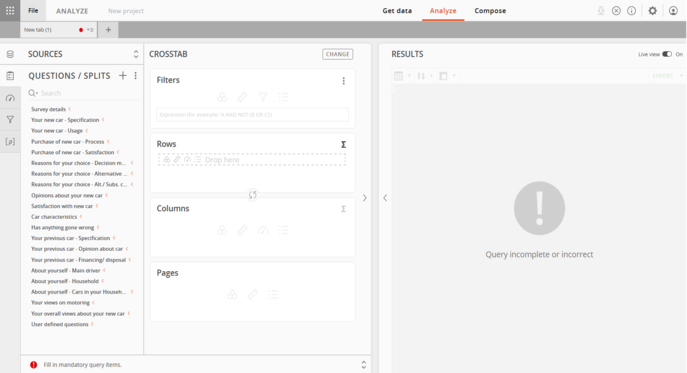
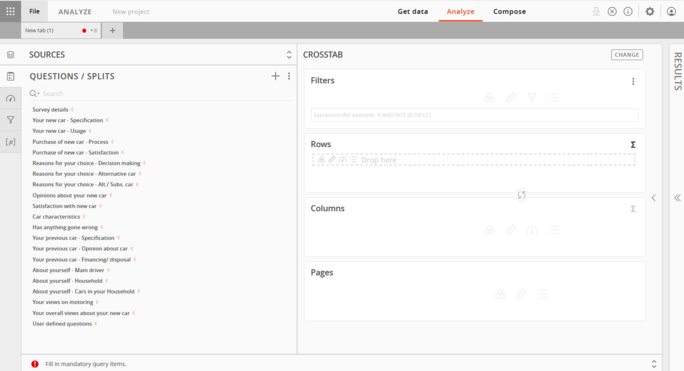
Once the tab template is chosen, the Analyze section can be opened in two view modes (split view or full query), depending on what is set in the global settings.
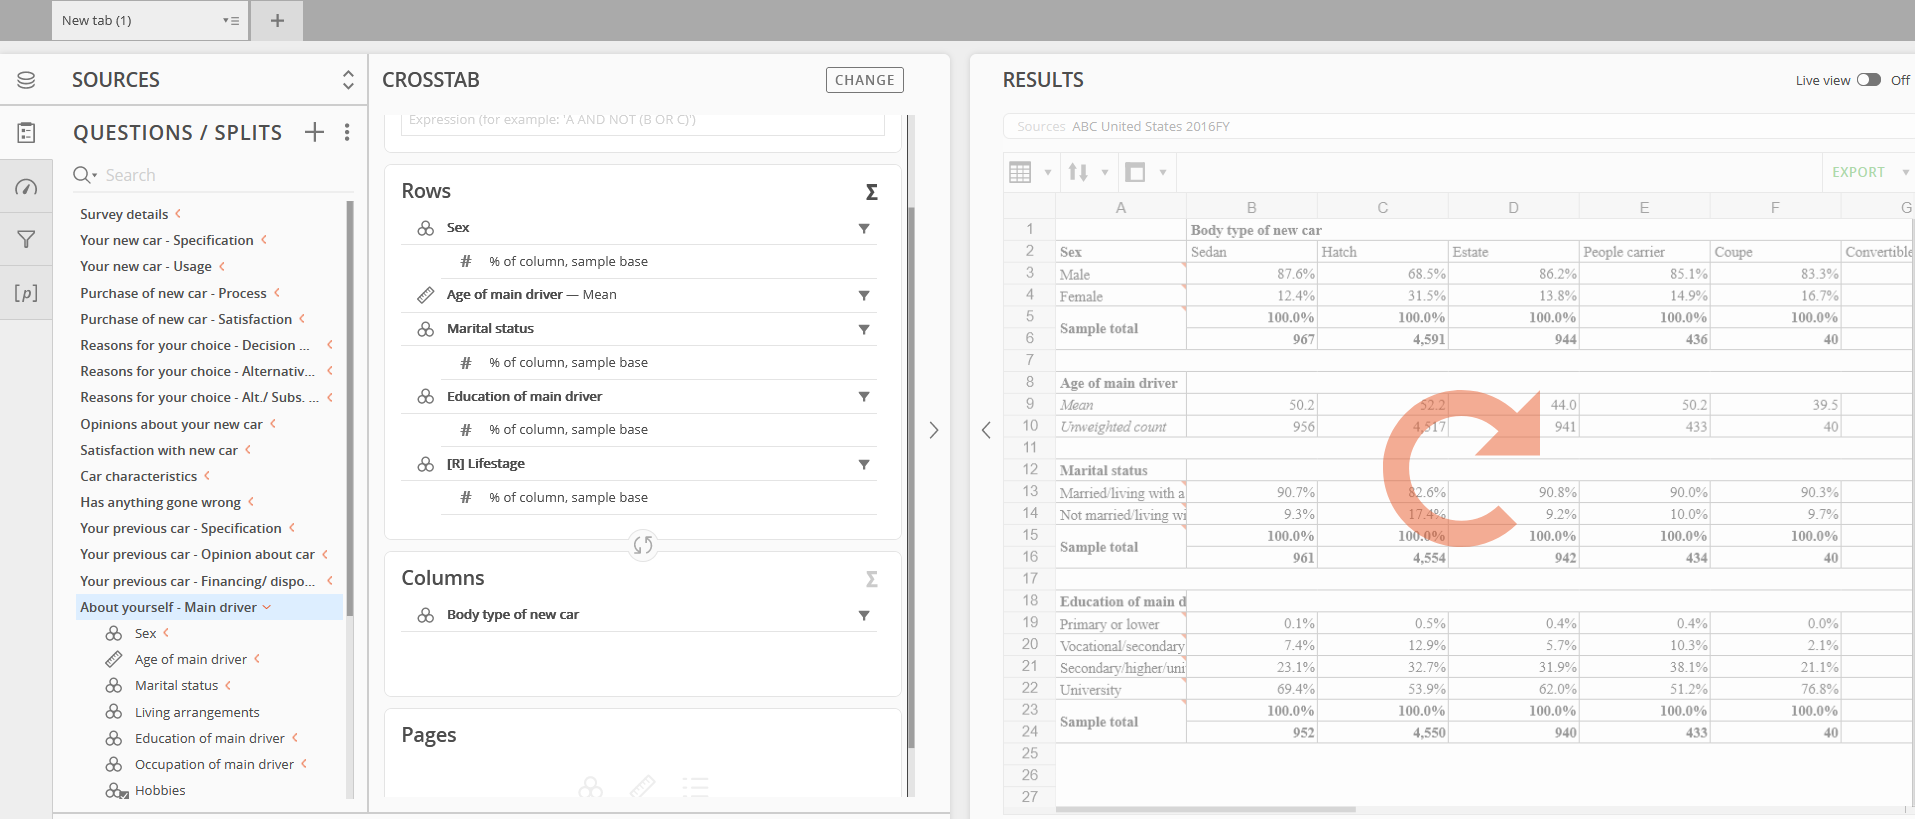
Split View
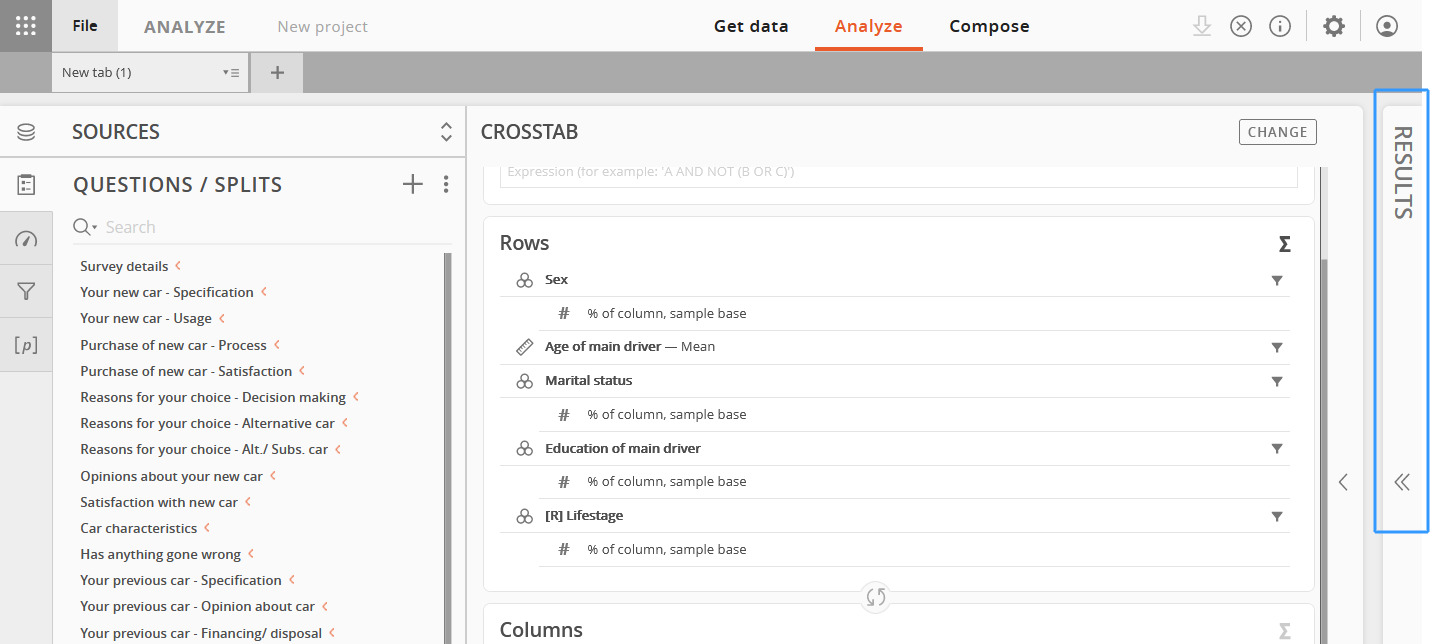
Full query
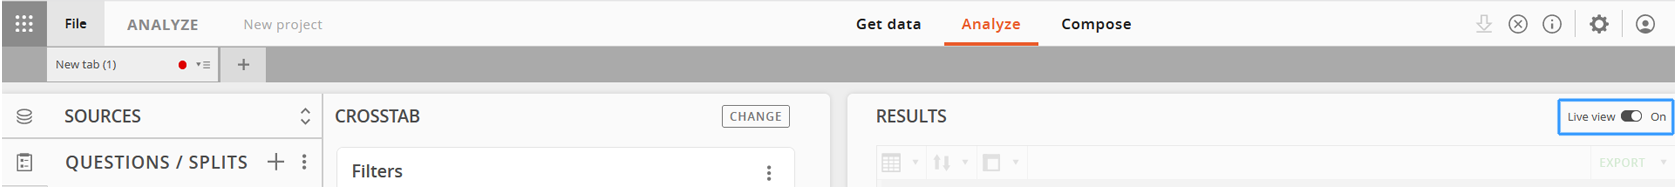
When working in the split view, the Live View switch on the right side of the results section will be set to "on" by default.
The results section will be updated dynamically as changes are made to the query.
If Live View is switched to "off," click the reload icon to generate the results.
When working in the full query view, click the Results navigation bar to view the results of the report.