Under the Global Settings, the previous setting for Default Place for Statistics has been renamed to Default Place and Display of Statistics and now includes Rows, Suppress Statistic Labels as a new option.
This setting now controls the crosstab orientation properties for the default placement of statistics as well as showing the statistic labels in the spreadsheet results when the row option is selected.
The three available settings are:
Columns (stat labels shown)
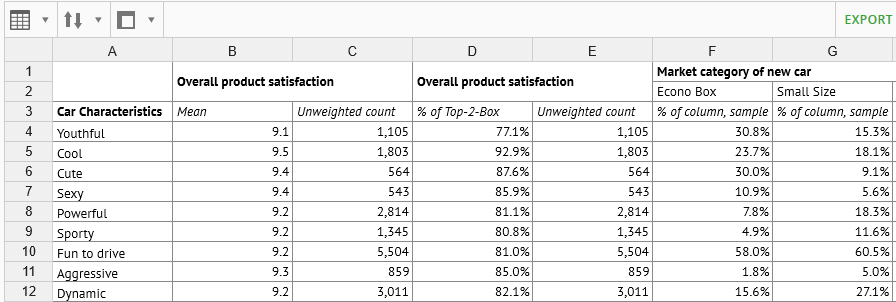
Rows (stat labels shown)
Rows, Suppress Statistic Labels (new)
Columns (no change in output from previous version of Analyze)
Rows (no change in output from previous version of Analyze)
Note: Column B includes the label (% of column, sample) for category questions.
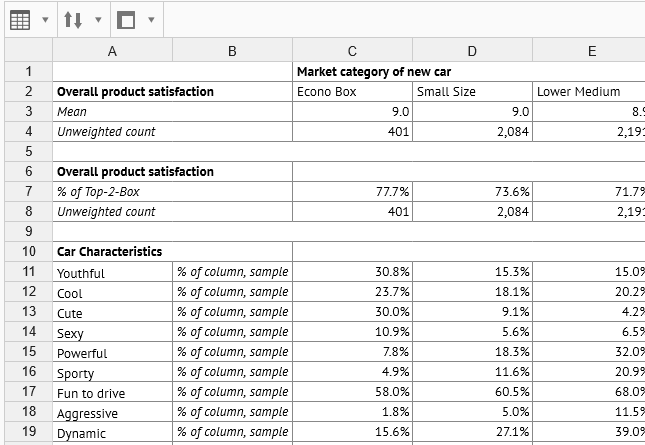
Rows, Suppress Statistic Labels
The question statistic format labels (% of column, sample) for category questions are now hidden in the spreadsheet output.
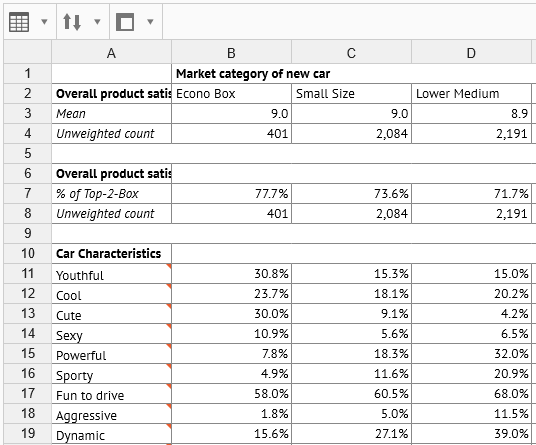
If exported to a spreadsheet, the question statistic format labels (% of column, sample) will be included as comments in the XLSX file.
Note: This setting that suppresses question format labels applies to category questions only.
It does not apply to numeric questions such as mean or Top Box.