One of key features of KPIs implemented in Anayzer is the fact that the each KPI's definition already includes the set of most reasonable statistics that can be used to correctly calculate the results. You do not have to bother how to technically construct your query. Very important thing about calculations in Analyze is that they are always performed on weighted values.
All calculations that can be found in Analyze are listed below with short explanations:
• Mean – arithmetical average of weighted values.
• Unweighted count – unweighted number of responses/cases (excluding missing values).
• Unweighted count (base) – unweighted number of respondents answering the questions (excluding missing values). If respondent can give more that one answer, unweighted number of respondents might not be equal to the sum of all unweighted answers.
• Percentages - share of all or selected answers in total results.
• Top-3-box - aggregated share of top 3 answers in total results.
• Volume - share of answers in total object's results.
• Index - share of answer for object in relation to share of answer for total market.
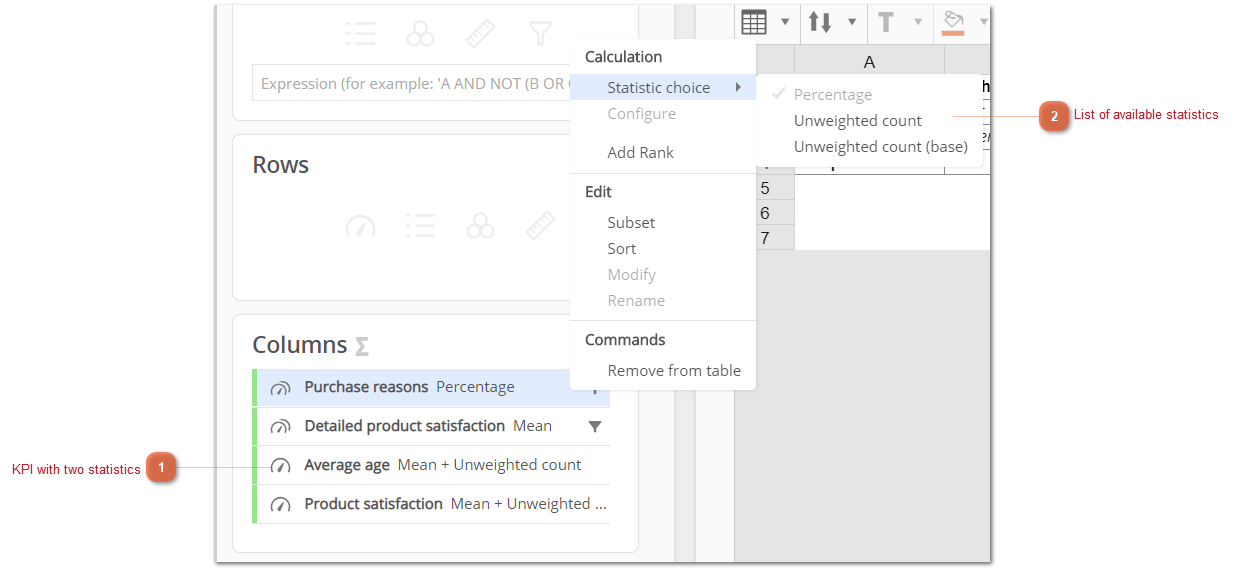
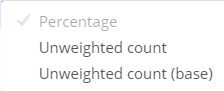
Left click on menu icon will open a list of all statistics available for the KPI.
KPI with two statistics
It is possible to select more than one statistics from the list.