Grid: Getting Started with a Basic Grid
Creating a Basic Grid Example
Please refer to the step-by-step instructions provided below, which include a basic "how-to" example and several more advanced Grid examples for reference. Follow these instructions to effectively use the Grid feature in Compose and create clear and informative presentations.
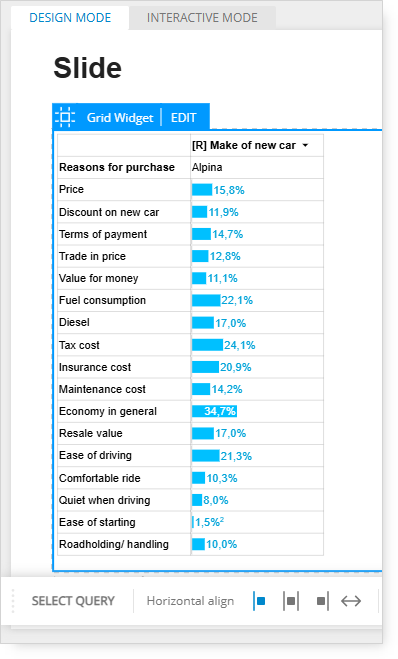
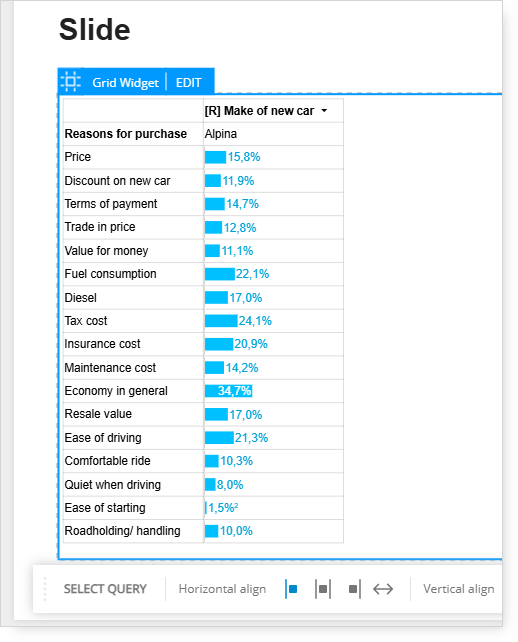
The following steps will create a basic grid with bars. This completed grid shows all the purchase reasons given for a particular brand, Alpina.
Create a basic Grid
-
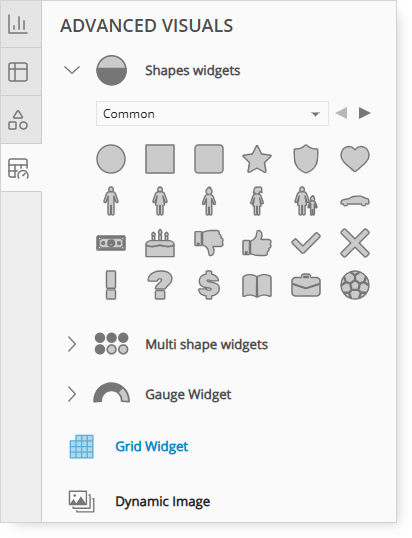
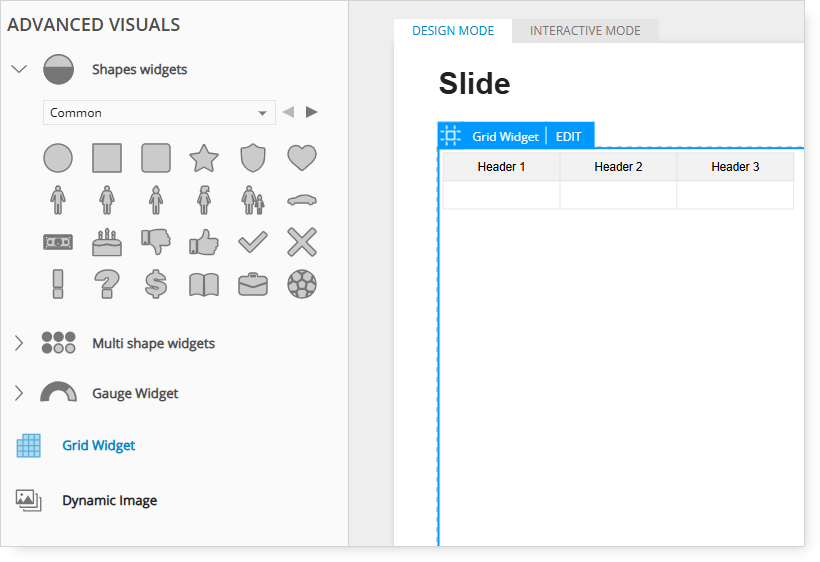
Start with a blank page in Compose and drag the Grid Widget icon onto the page.
-
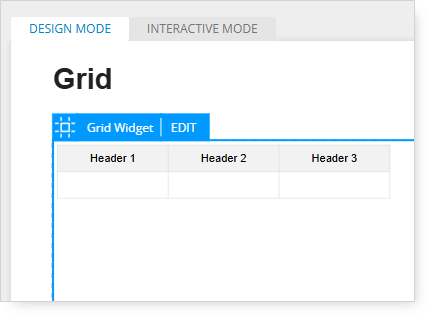
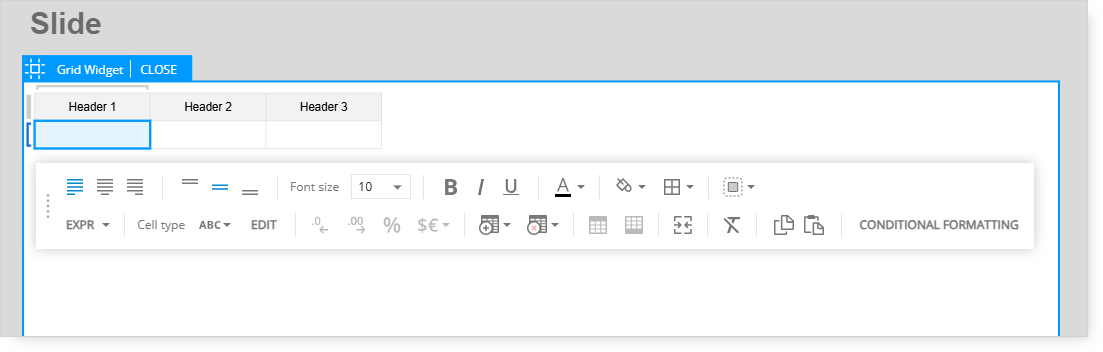
A new, empty grid will appear.
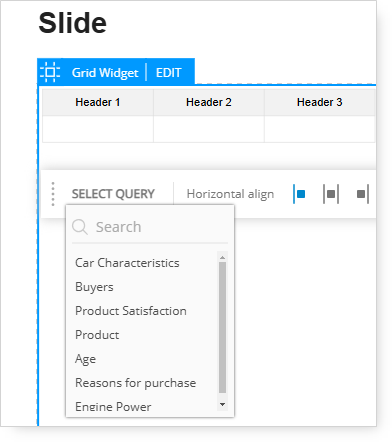
At this point you can either use the Select Query option or use Data Reference to populate the cells with data.
Select Query
If you choose to continue your work by using the Select Query option, then the only thing you need to do in order to populate your grid is to choose the Query from the list which is displayed after you click on Select Query. The cells will contain all the data from the chosen query.
Formatting the Grid Results
-
Go to the Edit mode to change the percentages to bars.
-
Select the right cell with the data values.
-
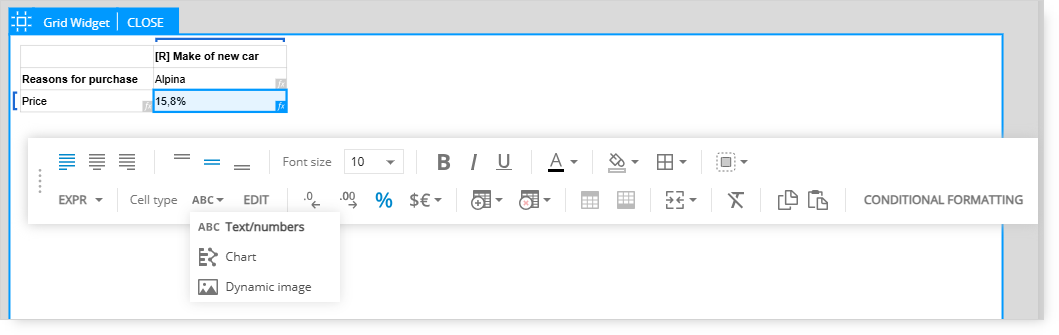
In the bottom menu bar, click the ABC menu to expand the options.
-
Select the Bar Chart option. The percentages will be changed to bars.
-
Click the Edit option next to ABC/Bar Chart menu to change the color of the bars.
This is the finished example of a basic grid created with the help of Select Query.
Data Reference
If you want to present different chart to the one that is in Query, you can use Data Reference.
Data references paired with flexibility of the expressions language allow to:
-
Transform original query results before putting them on a slide.
-
Combine information coming from multiple queries, possibly from multiple different data sources.
Data references in expressions can be used to populate:
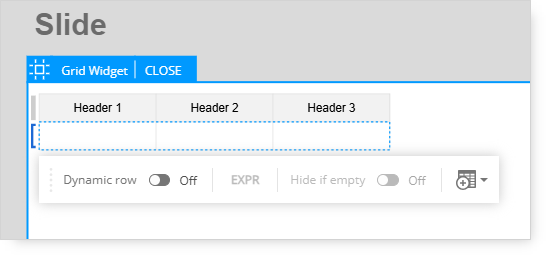
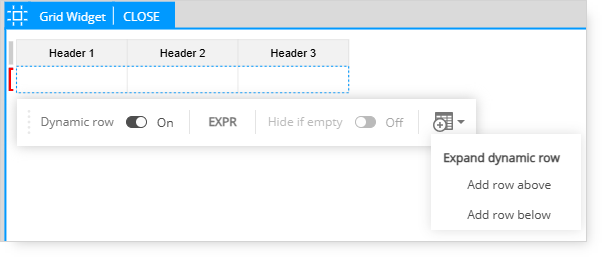
After entering the Edit mode, the next step is to turn on the Dynamic Row option.
Hover over the left border of the first cell and a blue bracket will appear.
Click the blue bracket to display the menu for the Dynamic Row, then turn it on.
By selecting the last icon in the Edit Mode the table can be expanded, you can add Dynamic Row above or below the current selection. The same can be done in case of Dynamic Columns.
A Dynamic Row is needed because we want to create a reference for the purchase reason listed in the first row and have the rows for all the remaining purchase reasons populate automatically (and dynamically).
Switching on the Dynamic Row option will change the color of the bracket to red.
This indicates that the data range for the Dynamic Row needs to be defined.
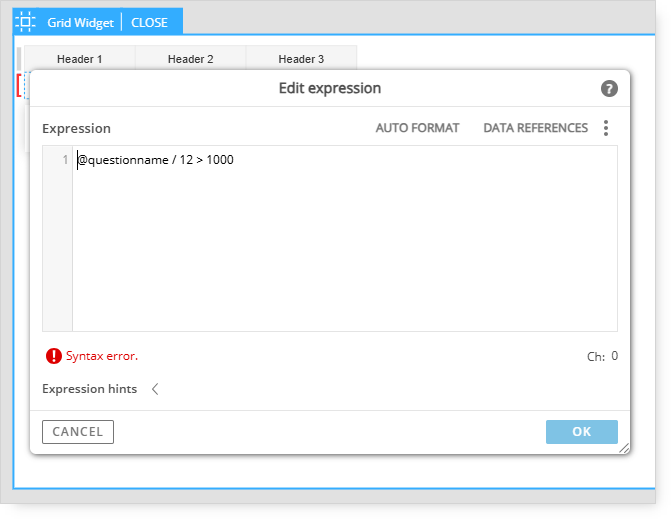
After switching on the Dynamic Row, click the Expression option (EXPR) in the menu bar.
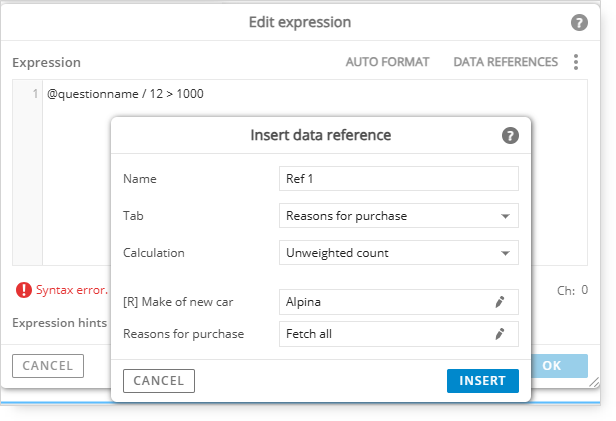
The expression editor window will appear.
Click the Data References option in the upper right corner.
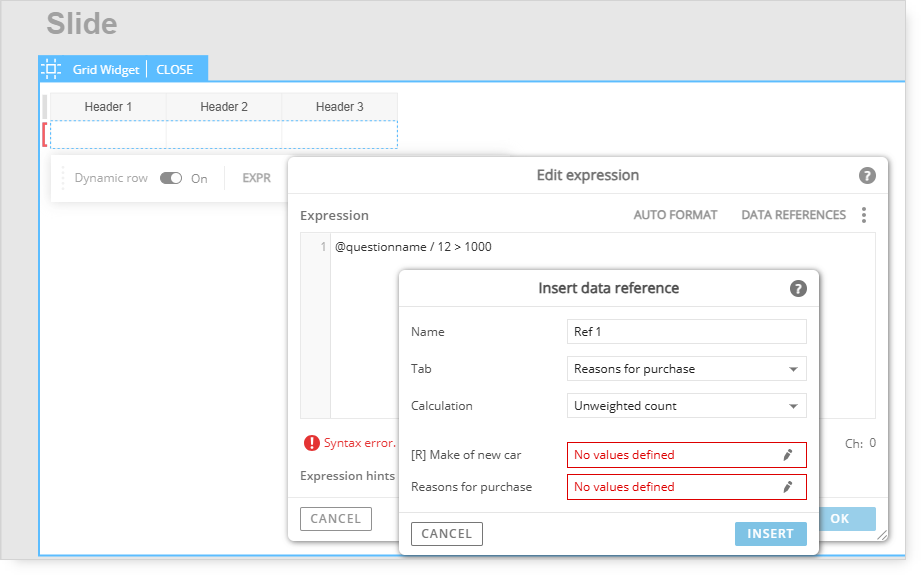
Follow the prompts to define the data references.
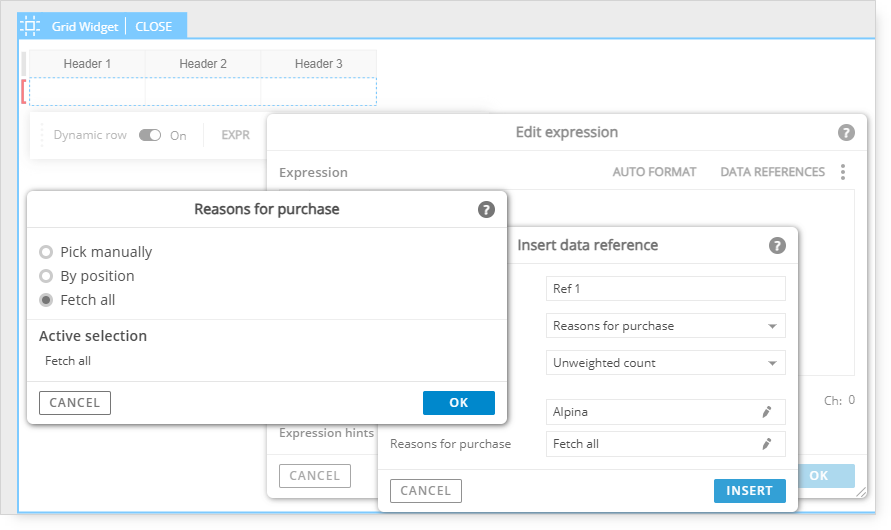
This is where the data range (tab, calculations, and questions) is selected.
For this data reference, we are selecting one make and all purchase reasons.
For this basic example, we will include just one make.
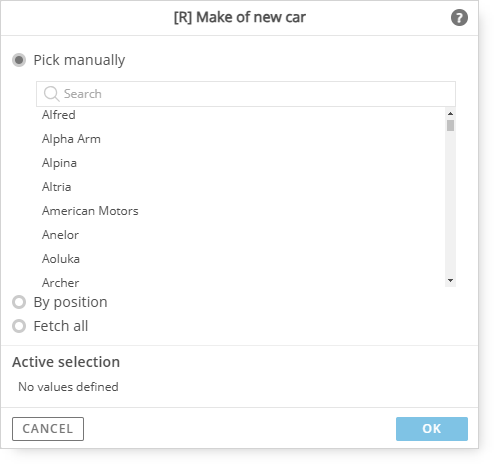
Select the Pick Manually option, then select the Alpina response.
All purchase reasons will be shown in the grid for the Alpina brand.
After manually selecting the Make of New Car, click the Fetch All option for the Reasons for Purchase.
The Fetch All option is used when we want to include all the responses in the dynamic selection.
With this example, Fetch All is being used to include all purchase reasons for the one manually selected make (Alpina) that we previously selected.
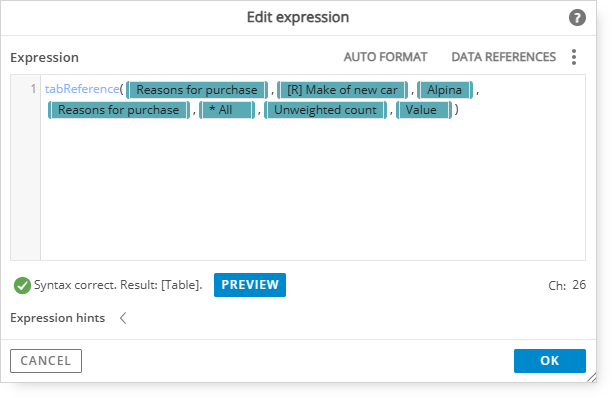
Confirm the selections, then click the Insert button.
The reference syntax is shown as correct with a green check mark.
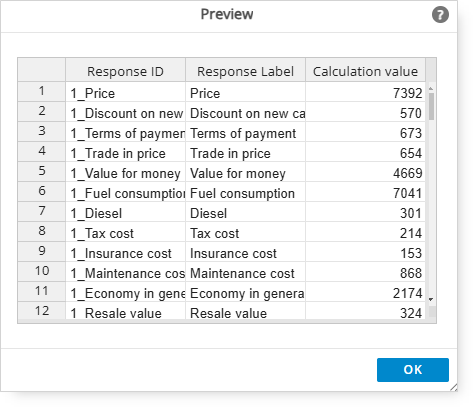
Click the Preview button to inspect the content that will be returned in the data reference.
Since Fetch All was selected for the Purchase Reasons, all reasons are listed in the table.
Note: If all Makes were shown instead of Purchase Reasons in this table preview, it most likely would be caused by the Fetch All selection being used on the make question instead of the Purchase Reason question. The data references would need to be revised and corrected.
Click OK to exit the Preview window, then click Apply to confirm the data reference.
The bracket that was previously red is now blue.
The data reference for the Dynamic Rows was created successfully.
The next step is to create additional expressions to fill the cells with some content.
Adding an Expression to Display Response Labels
Click on the first (left) cell. It will turn blue to indicate that it is currently selected.
A menu bar will appear at the bottom of the page.
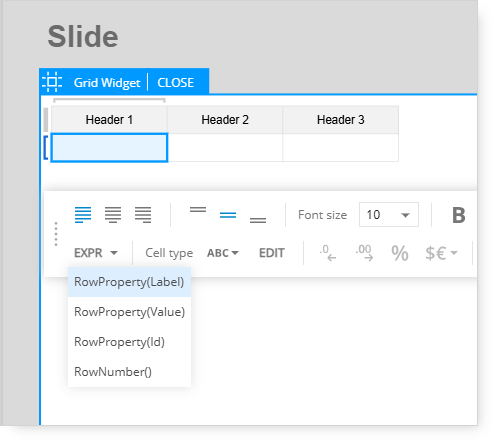
Expand the arrow next to EXPR option in the left corner, and select expressions you need.
Such an expression is required to display content in the selected cell. This can be done as well by going to Edit expression window and writing RowProperty(@Label).
You can also expand the Expression Hints, click the Context option, then double-click RowProperty to add it to the expression editor.
Hold the SHIFT key + @ to display the available RowProperty options.
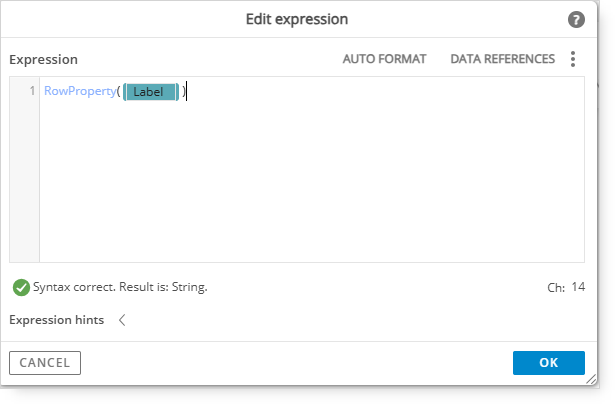
Select Label since we want to display the response label of the Purchase Reasons.
Finish the expression by typing a closed parenthesis “)”.
The syntax will appear as correct with a green check mark.
Click the OK button.
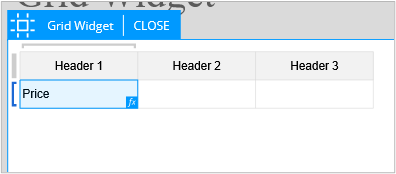
The Purchase Reason label is now shown in the left cell.
Adding an Expression to Display Response Values
Next, click in the middle cell. It will turn blue to indicate that it is currently selected.
A menu bar will appear at the bottom of the page.
You can follow the same path as it was in the case of the first column. Expand the arrow next to EXPR option in the left corner, and select expressions you need.
You can use the EXPR option in the lower left corner to open the expression editor.
An expression is required to display contents in the selected cell.
We will create an expression to show the percentage who chose the Purchase Reason.
Repeat the same steps we used for the left cell to display the response label.
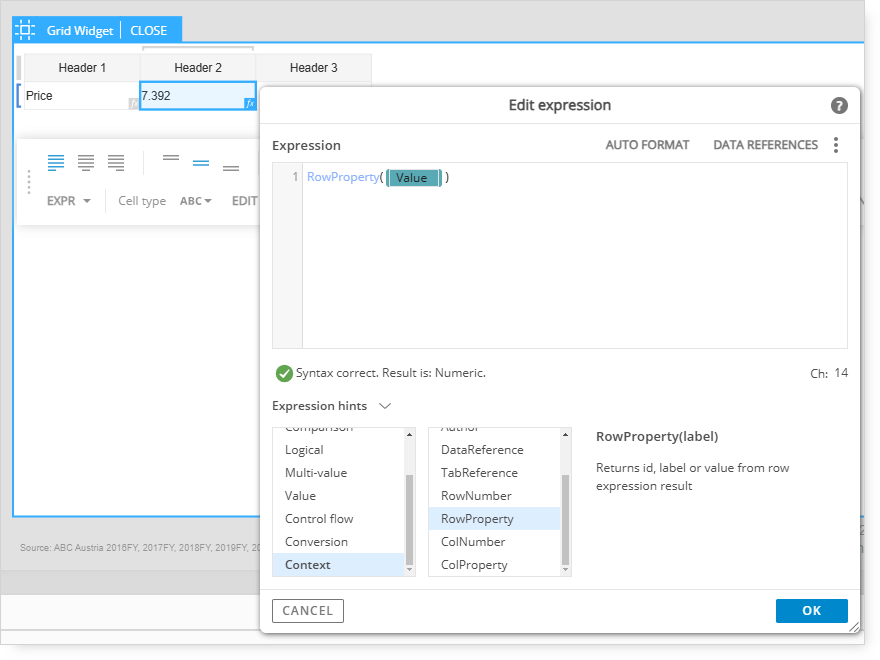
However, after entering '@' the available RowProperty options will be listed, select 'Value', since we want to display the actual data value for the Purchase Reasons.
Finish the expression by typing a closed parenthesis “)”.
The syntax will appear as correct with a green check mark.
Click the OK button.
The Purchase Reason value is now shown in the left cell.
Formatting the Grid
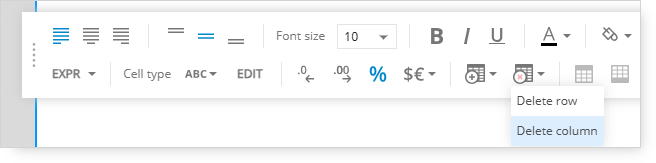
Select the third column. This column is not needed, so we can delete it.
In the menu, there is a grid icon with a red X, click that and select the Delete Column option.
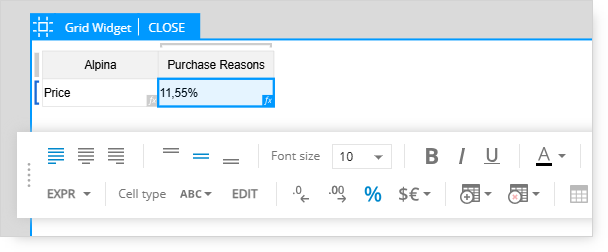
Next, manually type a description in each of the grey column header cells.
Select the value cell and the click the percentage icon (%) in the lower menu bar.
This will change the format of the values to percentages.
Next, click the .0 icon with the left arrow to reduce the number of decimals shown.
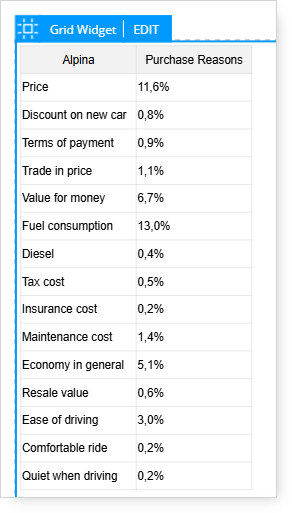
Click Close to exit Edit Mode.
This is what the newly created grid will look like.
Formatting the Grid Results
Return to Edit Mode to change the percentages to bars.
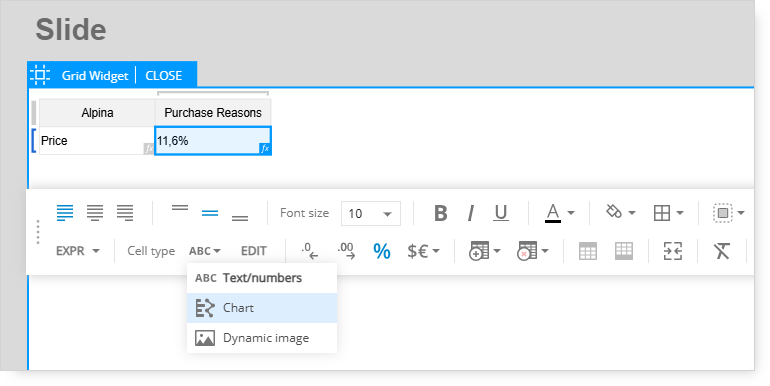
Select the right cell with the data values.
In the bottom menu bar, click the ABC menu to expand the options.
Select the Chart option.
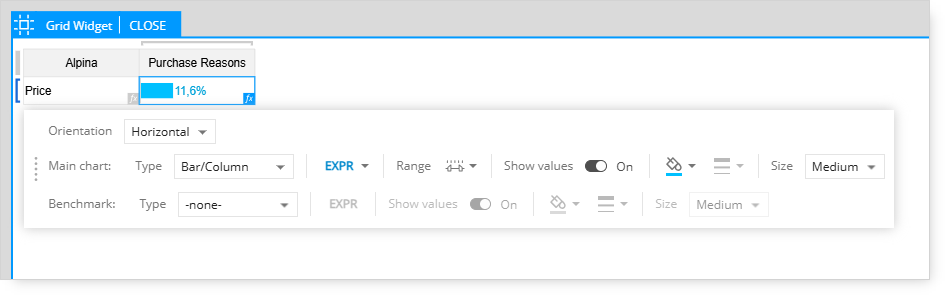
The percentages will be changed to bars.
Click the Edit option next to ABC/Chart menu to change the color of the bars.
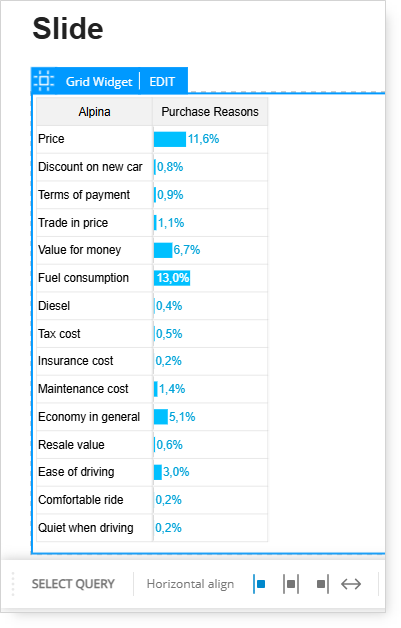
This is the finished example of a basic grid created with the help of Data Reference.